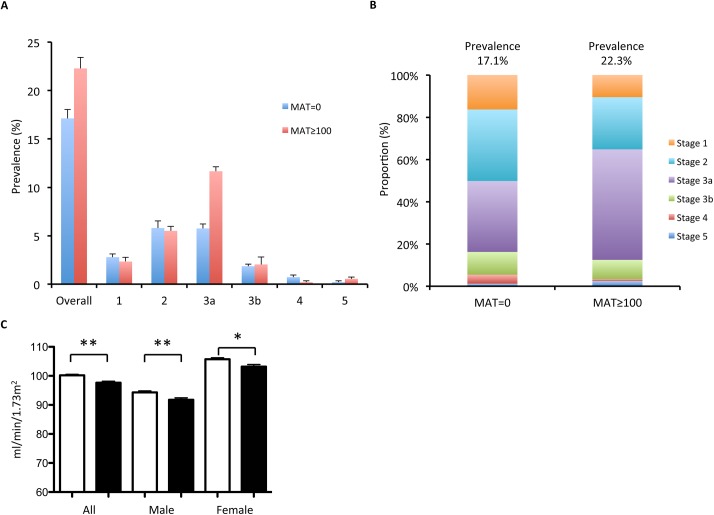
Fig 1. Prevalence and proportion of CKD (chronic kidney disease) stages by MAT titer zero and MAT titer ≥ 100 (A) Prevalence of CKD stages in MAT = 0 and MAT ≥ 100. (B) Proportion of CKD stages by in MAT = 0 and MAT ≥ 100. (C) eGFR (estimated glomerular filtration rate) in MAT = 0 (white bar) and MAT≥ 100 (black bar) of different groups (all, male, and female).
**p<0.001.

