
Fig 1.
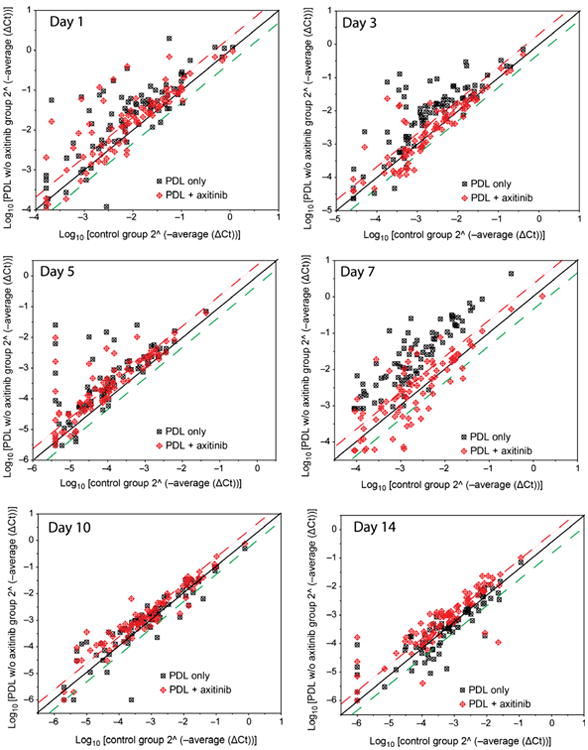
Scatter plots showing the expression profiles of 86 angiogenic factors with or without topical axitinib administration through days 1–14 after PDL exposure. The threshold was set at two times control. The squares above the upper threshold line (red) represent the angiogenic genes in treatment groups that had twofold or more increased mRNA levels compared with the normal control group. The squares below the lower threshold line (green) represent the angiogenic genes in treatment groups that had twofold or more decreased mRNA levels compared with the normal control group. The squares between both red and green threshold lines represent the angiogenic genes in treatment groups showing either increased or decreased mRNA levels within twofold compared with the normal control group values.