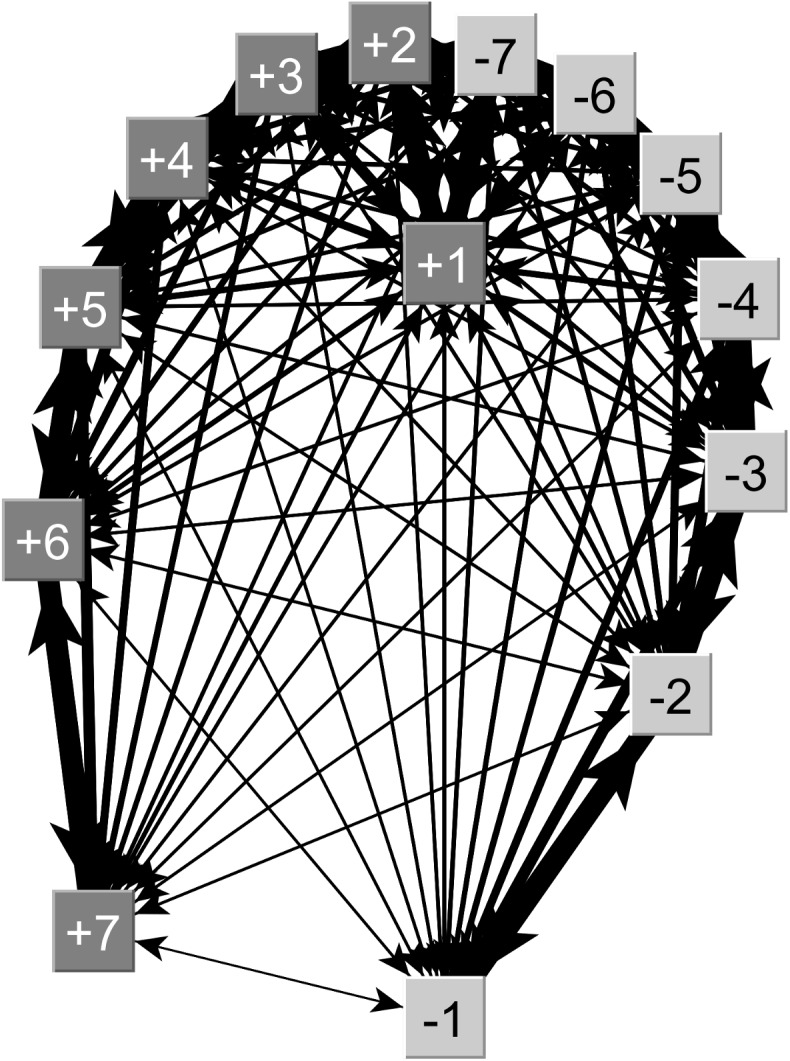
Fig 3. Network map of colonies from Simonswald on accepting drifters according to their indegree centrality.

Here we represent the observed indegree centrality based on the actual number of drifters. Each square represents a colony (“+”high Varroa; “-” low Varroa) whilst the number refers to the colony position at the apiary, with +1 and -1 being the two central hives and +7 and -7 those at the two ends of the row. The arrows represent the flow of drifters and their width is proportional to the number of drifters (from 1 to 4) going from one colony to another. Only Simonswald network is represented since more drifters were found in this site than in Kenzingen, which illustrates better our results.
