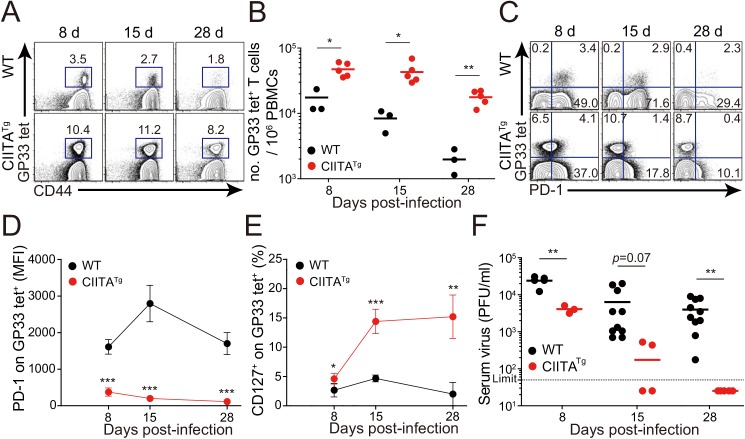
Fig 2. Accelerated viral control in CIITATg mice during LCMV clone 13 infection.
(A-E) Wild-type (WT) and CIITATg mice were infected with 5 x 10⁵ PFU of LCMV CL–13 per mouse. Peripheral blood mononuclear cells (PBMCs) were collected at indicated days post infection (DPI). Frequency of GP33-41 (GP33) tetramer-positive cells among CD8+ T cells were analyzed by flow cytometry (A) and the numbers of GP33 tetramer-positive CD8+ T cells per 106 PBMCs during the course of LCMV CL–13 infection are represented (B). Numbers in plots indicate percentage of the tetramer-positive cells among CD8+ T cells. PD–1 (C and D) and CD127 (E) expression by GP33 tetramer-positive cells after gating on CD8+ T cells were also analyzed, and summary showing the PD–1 expression level on GP33 tetramer-positive CD8+ T cells is represented by mean fluorescence intensity (MFI) (D). The percentage of CD127+ cells among GP33 tetramer-positive CD8+ T cells is also summarized (E). Line graph shows mean ± SD. Data are representatives of four independent experiments (n≥3 per group in each experiment). (F) Serum were collected at indicated DPI from the infected wild-type and CIITATg mice, and viral titer were checked. Dashed line indicates the virus detection limit. Undetectable samples were given a half of detection limit. Line graph shows mean ± SD. Data of (A-E) are representative of three independent experiments, and data of (F) is pooled from two independent experiments (n≥3 per group in each experiment).*P<0.05; **P<0.01; ***P<0.001.

