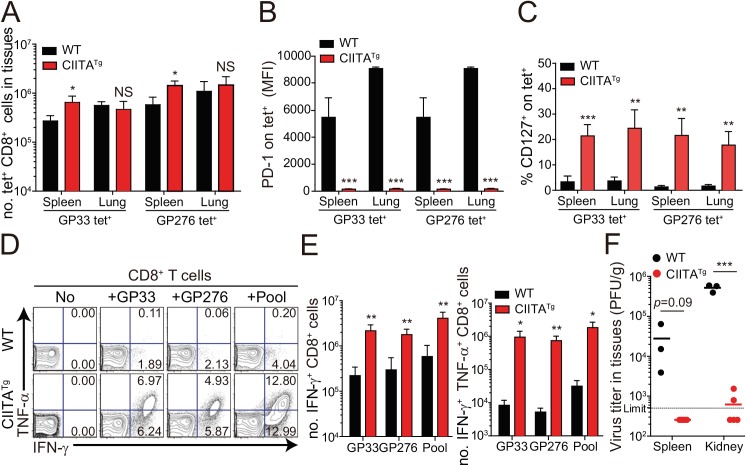
Fig 3. Phenotype and function of virus-specific CD8+ T cells in tissues of LCMV infected CIITATg mice.
(A-C) Lymphocytes were isolated from the spleen and lungs of LCMV CL–13 (5 x 10⁵ PFU per mouse) infected wild-type and CIITATg mice at 31 DPI and analyzed by flow cytometry. Total numbers of GP33 and GP276-286 (GP276) tetramer-positive CD8+ T cells (A) and PD–1 expression level on tetramer-specific CD8+ T cells (B) in the spleen and lungs of wild-type and CIITATg mice are represented. Percentages of CD127+ cells among virus-specific CD8+ T cells in the indicated tissues are also summarized in the bar graph (C). (D and E) Splenocytes were restimulated in vitro with GP33, GP276, or LCMV peptide pool (GP33, GP276, GP118-125, GP92-101, and GP70-77) and stained for CD8+ T cells. Frequency of IFN-γ- and TNF-α-producing CD8+ T cells were analyzed by flow cytometry (D), and absolute numbers of CD8+ T cells producing IFN-γ and producing both IFN-γ and TNF-α in the spleen are summarized, respectively (E). Numbers in the plots indicate the percentage of TNF-α+ and TNF-α- CD8+ T cells producing IFN-γ, respectively. (F) Viral titers were checked in the spleen and kidney extracted from LCMV CL-13-infected mice at 31 DPI. Dashed line indicates the virus detection limit. Undetectable samples were given a half of detection limit. Bar graphs show mean + SD. Data are representative of three independent experiments (n≥3 per group in each experiment). NS, not significant; *P<0.05; **P<0.01; ***P<0.001.

