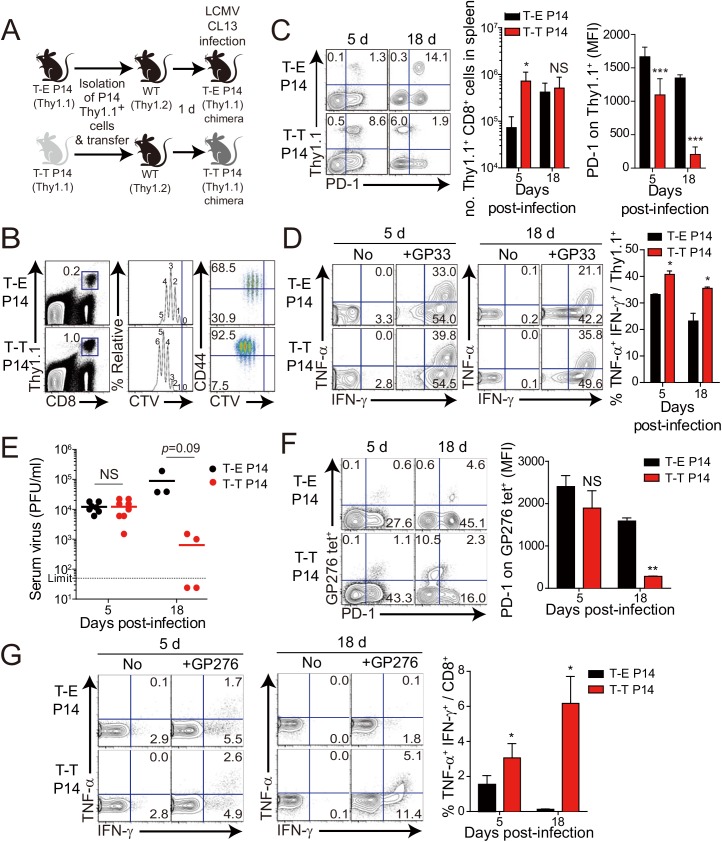
Fig 6. Control of chronic LCMV infection by innate CD8+ T cells.
(A) T-E and T-T P14 cells were isolated from the spleens of each BM chimera as shown in Fig 5 and transferred into Thy1.2+ congenic C57BL/6 mice. One day after transfer, the mice were infected with 5 x 10⁵ PFU of LCMV CL–13 per mouse. (B-D) Thy1.1+ CD8+ donor P14 cells were gated for following analysis. (B) CellTrace Violet (CTV)-labelled donor T-E and T-T P14 cells were analyzed at 2.5 DPI by flow cytometry. Frequency of Thy1.1+ CD8+ P14 cells among splenocytes are depicted. The gated donor Thy1.1+ CD8+ P14 cells are examined for CTV dilution along with CD44 expression. Division time and frequency of CD44hi cell population are indicated in histogram plot. (C) Lymphocytes were isolated from the spleens of T-E and T-T P14 chimeric mice at 5 and 18 DPI and analyzed by flow cytometry. The number of Thy1.1+ P14 cells in the spleen and PD–1 expression among CD8+ T cells were analyzed at indicated DPI. Numbers in the plots indicate PD–1+ or PD–1- Thy1.1+ transferred cells. PD–1 expression level (MFI) on Thy1.1+ transferred cells is summarized in the graph. (D) Splenocytes of T-E and T-T P14 chimeric mice were restimulated in vitro with GP33 for P14 cells, and frequency of IFN-γ- and TNF-α-producing Thy1.1+ transferred cells were analyzed. Numbers in the plots indicate the percentage of TNF-α+ and TNF-α- CD8+ T cells producing IFN-γ, respectively. Frequency of Thy1.1+ transferred cells producing both IFN-γ and TNF-α was summarized in the graph. (E) Serum viral titers were checked in T-E and T-T P14 chimeras at the indicated DPI. Dashed line indicates the virus detection limit. Undetectable samples were given a half of detection limit. (F-G) CD8+ T cells were gated for following analysis. (F) PD–1 expression on GP276 tetramer-positive CD8+ T cells was analyzed at indicated DPI. Numbers in the plots indicate PD–1+ or PD–1- GP276 tetramer-positive cells among CD8+ T cells. PD–1 expression level (MFI) on GP276 tetramer-positive CD8+ T cells is summarized in the graph. (G) Splenocytes of T-E and T-T P14 chimeric mice were restimulated in vitro with GP276 peptide for endogenous CD8+ T cells, and frequency of IFN-γ- and TNF-α-producing CD8+ T cells was analyzed. Numbers in the plots indicate the percentage of TNF-α+ and TNF-α- CD8+ T cells producing IFN-γ, respectively. Frequency of CD8+ T cells producing both IFN-γ and TNF-α was summarized in the graph. Bar graphs show mean + SD. Data are representative of more than two independent experiments (n≥3 per group in each experiment). NS, not significant; *P<0.05; **P<0.01; ***P<0.001.

