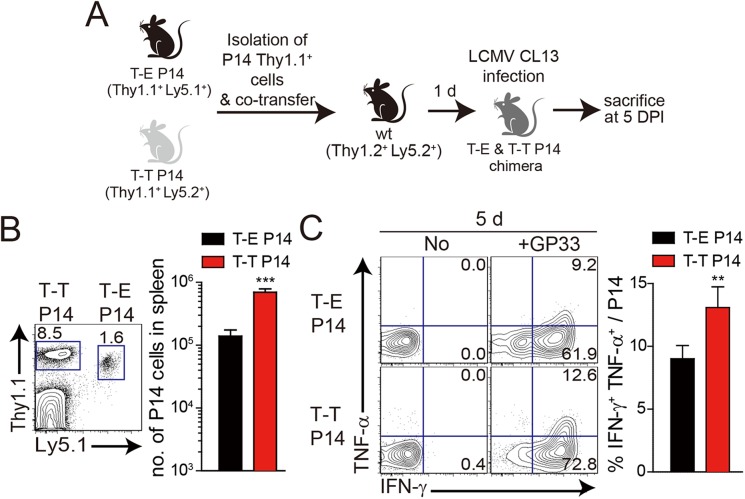
Fig 7. Co-adoptive transfers of T-E and T-T P14 cells.
(A) T-E P14 (Thy1.1+Ly5.1+) and T-T P14 (Thy1.1+Ly5.2+) cells were isolated from the spleens of each BM chimera as shown in Fig 5 and transferred into Thy1.2+Ly5.2+ congenic C57BL/6 mice. One day after transfer, the mice were infected with LCMV CL–13. (B) Lymphocytes were isolated from the spleens of recipient mice at 5 DPI and analyzed by flow cytometry. Numbers in the plot indicates the frequency of transferred T-E or T-T P14 cells among CD8+ T cells in the spleen and absolute numbers of Thy1.1+Ly5.1+ and Thy1.1+Ly5.2+ cells in the spleen are summarized in the graph. (C) Splenocytes of T-E and T-T P14 chimeric mice were restimulated in vitro with GP33 for P14 cells, and frequency of IFN-γ- and TNF-α-producing P14 cells were analyzed. Numbers in the plots indicate the percentage of TNF-α+ and TNF-α- P14 cells producing IFN-γ, respectively. Frequency of P14 cells producing both IFN-γ and TNF-α was summarized in the graph. Bar graphs show mean + SD. n≥4 per group in each experiment. **P<0.01; ***P<0.001.

