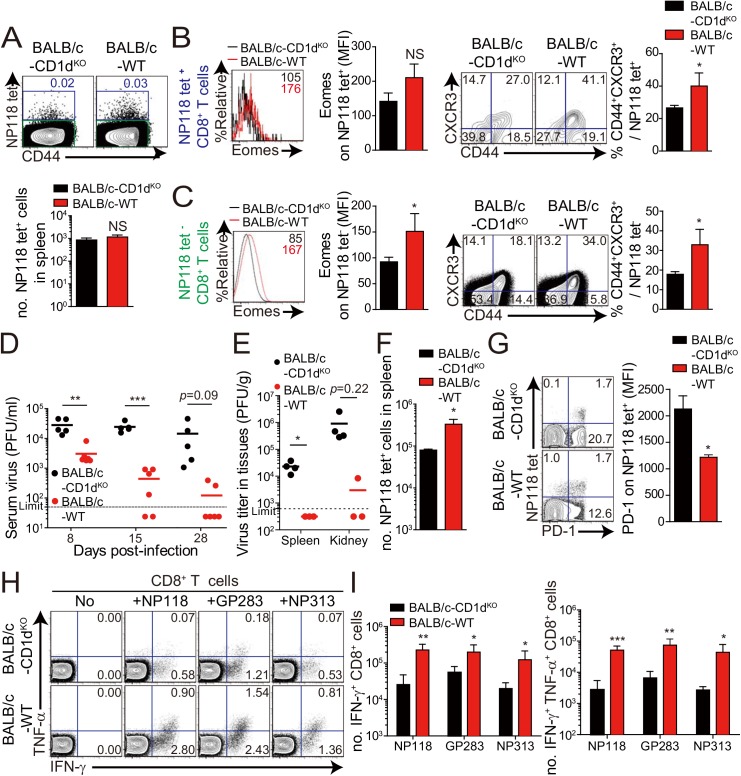
Fig 8. Accelerated viral control in BALB/c wild-type mice compared to BALB/c-CD1dKO mice.
(A-C) CD8+ T cells were enriched from the spleens of BALB/c-CD1dKO and BALB/c wild-type by using magnetic sorting. NP118 tetramer+ or tetramer- CD8+ T cells were analyzed by flow cytometry. (A) NP118 tetramer+ cells are gated in blue and NP118 tetramer- cells are gated in green. The numbers in the plots indicated the frequency of NP118 tetramer+ cells among CD8+ T cells. Absolute number of NP118 tetramer+ cells in the spleen is represented in the bar graph. (B and C) Eomes expression on NP118 tetramer+ or tetramer- cells in BALB/c-CD1dKO and BALB/c wild-type. Numbers in the histogram plots indicate MFI values of Eomes stained on NP118 tetramer+ or tetramer- cells. MFI value is summarized in the bar graph. Numbers in the contour plots indicate the frequency of each population in the quadrants depending on CD44 and CXCR3 expression. The frequency of CD44hiCXCR3+ cells are summarized in the bar graph. (D-I) BALB/c-CD1dKO and BALB/c wild-type mice were infected with 2 x 10⁵ PFU per mouse of LCMV CL–13. (D and E) Virus titers were checked in serum at the indicated DPI and in spleen and kidney extracted at 29 DPI. Dashed line indicates the virus detection limit. Undetectable samples were given a half of detection limit. (F) Absolute numbers of NP118 tetramer-positive CD8+ T cells in the spleen and lung of CL–13 infected mice were analyzed at 29 DPI. (G) Numbers in plots indicate percentage of PD–1+ or PD–1- CD8+ T cells. PD–1 expression by NP118 tetramer-positive cells after gating on CD8+ T cells were also analyzed, and summary showing the PD–1 expression level on NP118 tetramer-positive CD8+ T cells is represented by mean fluorescence intensity (MFI). (H and I) Splenocytes were restimulated in vitro with NP118, GP283-291 (GP283), or NP313-322 (NP313), and frequency of IFN-γ- and TNF-α-producing CD8+ T cells were analyzed by flow cytometry (H). Numbers in the plots indicate the percentage of TNF-α+ and TNF-α- CD8+ T cells producing IFN-γ, respectively. Absolute numbers of CD8+ T cells producing IFN-γ or both IFN-γ and TNF-α in the spleen are summarized (I). Bar graphs show mean + SD. Data are representative of two independent experiments (n≥3 per group in each experiment). *P<0.05; **P<0.01; ***P<0.001.

