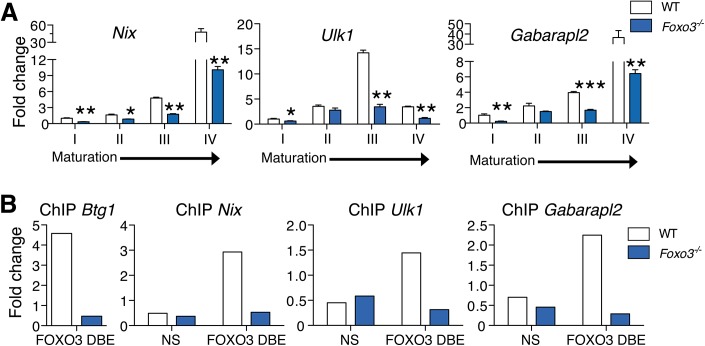
Fig 2. FOXO3 regulates expression of autophagy and mitochondrial removal related genes in erythroblasts.
(A) Fluidigm microfluidic qRT-PCR expression analysis of autophagy genes in WT and Foxo3 -/- Gates I to IV bone marrow erythroblasts. Quantification of target genes is relative to β actin. Results are mean ± SEM of 3 cDNAs, each generated from one mouse. *P < 0.05 **P < 0.01 ***P < 0.001, Student’s t test. (B) FOXO3 binding to Btg1, Nix, Ulk1 and Gabarapl2 regulatory regions as determined by ChIP in total TER119+ cells. Enrichment of putative FOXO3 DNA binding regions in Btg1 (positive control), Nix, Ulk1 and Gabarapl2 promoters was analyzed by qPCR and compared to regions with no known FOXO3 binding sites in wild type versus Foxo3 -/- erythroid cells used as negative controls. Values were normalized to Ct values from total input. One representative of two experiments is shown. NS Not specific; DBE DNA binding element.

