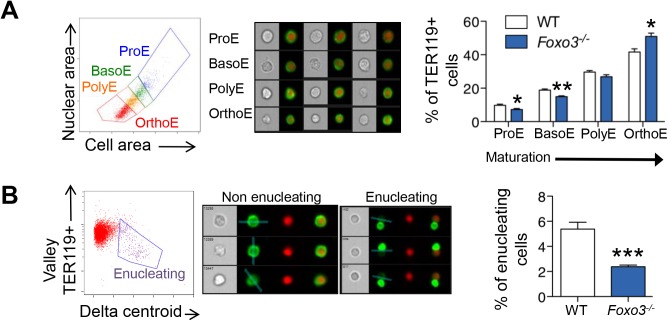
Fig 5. Defective Foxo3 -/- terminal erythroblast maturation.
(A) Delineation of erythroblasts by imaging flow analysis based on decreasing cell and nuclear size (left). Images of typical cells (middle panel) in bright-field (gray) and composite image of TER119 (green) and DRAQ5 DNA stain (red). Results are mean ± SEM of n = 4. (B) Gating of enucleating cells from the orthochromatic erythroblasts (in A) based on difference between the center of the nuclear stain and TER119 stain (Delta centroid on X) and a decreasing TER119 signal in the valley mask (highlighted in blue on TER119 image) which goes through the lowest signal point and thus marks the boundary between the reticulocyte and pyrenocyte. Cells with no signal in this mask are eliminated as close doublets. Results are mean ± SEM of n = 4. *P < 0.05 **P < 0.01 ***P < 0.001, Student’s t test.

