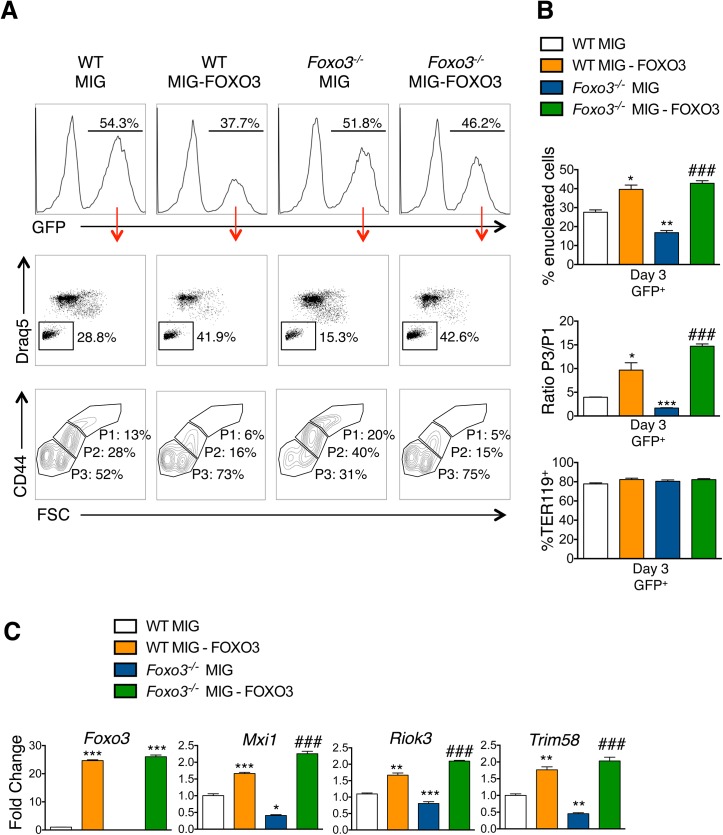
Fig 7. Ectopic expression of FOXO3 rescues terminal maturation and enucleation in Foxo3 -/- erythroblasts.
(A) WT and Foxo3 -/- bone marrow erythroid progenitors were expanded and transduced with either the MIG vector overexpressing FOXO3 (MIG-FOXO3) or the MIG vector alone, transferred to erythroid differentiation medium and incubated for additional three days of maturation after which cells were analyzed by flow cytometry. Upper panels show the percentage of transduced cells within each culture condition after maturation. Middle panels show representative FACS plots for each condition indicating the percentage of enucleated cells within transduced (GFP+) cells. Bottom panels show representative FACS plots of maturing erythroblasts. P1 represents the most immature and P3 the most mature erythroid populations. (B) Quantification of enucleation in GFP+ cells shown as mean of percent enucleated ± SEM of n = 3 (Upper panel). Quantification of overall maturation kinetics is based on CD44 and FSC parameters as a ratio between the most mature population (P3) over the least mature population (P1) (middle panel). TER119+ cells (%) is shown (bottom panel). (C) qRT-PCR expression analysis of enucleation-related genes in WT and Foxo3 -/- GFP+ FACS sorted cells after 3 days of maturation. Quantification of genes is normalized to β actin and relative to WT cells transduced with MIG. Results are mean ± SEM of duplicates of 3 cDNAs. *P < 0.05 **P < 0.01 ***P < 0.001 compared to WT MIG, ### P < 0.001 compared to Foxo3 -/- MIG; Students t test.

