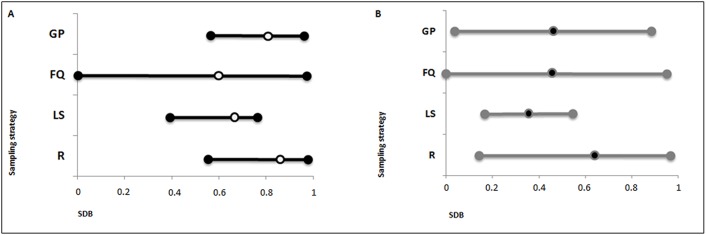
Fig 2. Minimum, maximum and mean values of the sampling-dependent bias (SDB) calculated after sampling by random (R), locally spread (LS), first quartile (FQ) and grandparents (GP) strategies, under the low-kinship (A) and the high-kinship (B) models in the 26 investigated communities.