
Fig 5. Changes of MPOD levels (a) and serum lutein concentration (b) in three different response pattern groups.
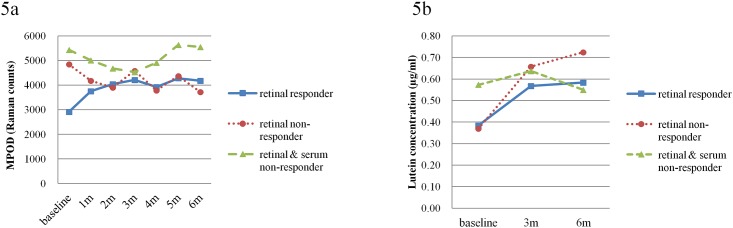
The subjects represented by the solid line showed increases in both MPOD levels and serum lutein concentrations. These subjects were designated “retinal responders”. The subjects represented by the dotted line had no increase in MPOD levels but had increases in serum lutein concentrations. These subjects were designated “retinal non-responders”. The subjects represented by the broken line had no increase in both MPOD levels and serum lutein concentrations. These subjects were designated “retinal and serum non-responders”.