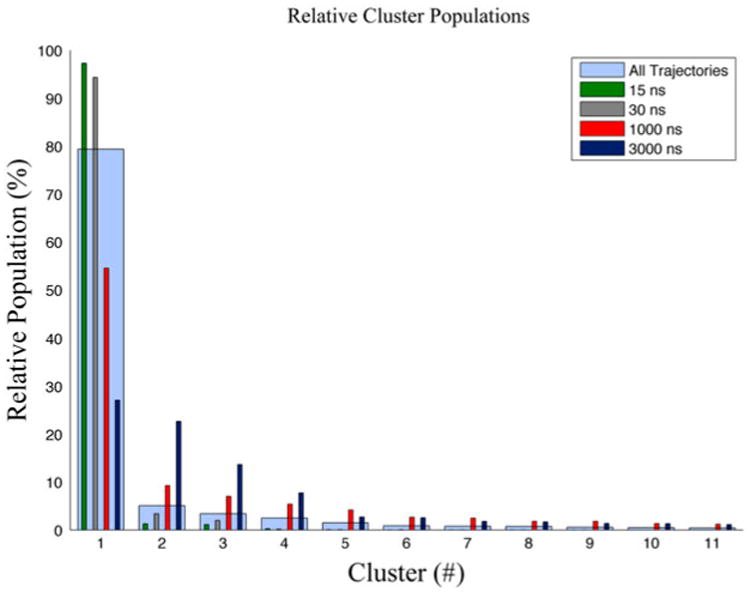
Figure 4.

Relative cluster populations.
Notes: Relative cluster populations comparing clustering results of each trajectory clustered separately to that of all trajectories combined. The nanosecond simulations are both dominated by the lowest order cluster, where the microsecond clusters show a more diverse clustering population, and all clustering straddles the timescales.
