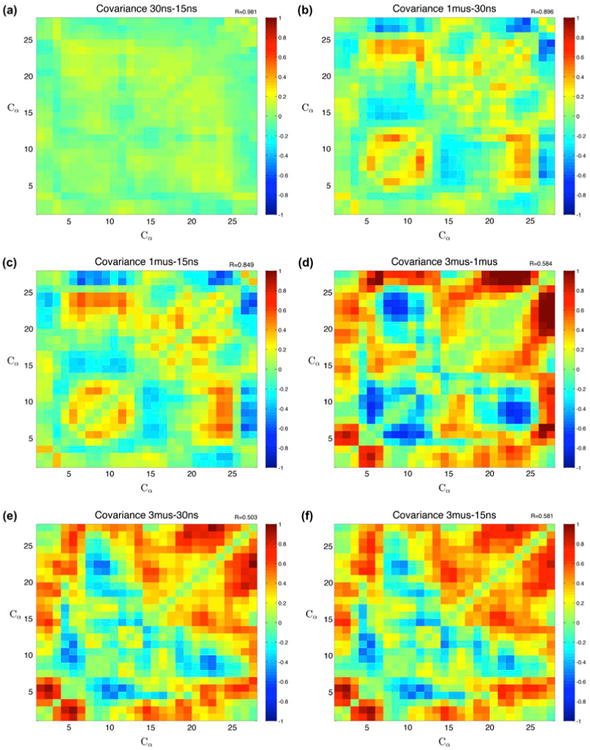
Figure 7.

Covariance differences.
Notes: Subtracted covariances of different timescales along with corresponding correlation coefficients. The nanosecond simulations have the highest correlation, while the 3 μs simulations have the lowest correlations, and highlight correlation with the alpha helix region and the tail, and anti-correlation between two zinc-binding residues, a histidine (22) and a cysteine (9). (a) Comparing the two nanosecond timescales, shows very high correlation and little deviation. (b) The next longest interval difference shows differences in the secondary structures, mostly in the beta sheets. (c) Very similar to the other nanosecond comparison, the 1000–15 ns comparison also shows differences in the correlation near the beta sheet and zinc-binding location. (d) Comparing the two microsecond simulation sets, there is change between the tail and the beta sheet, as well as changes with the long-range beta sheet interactions. (e) The covariance between the 3000 and 30 ns simulations is the least correlated at R = .503. (f) The largest difference in timescales shows little correlation, and changes appear with the alpha-helix region as well as the tail regions.
