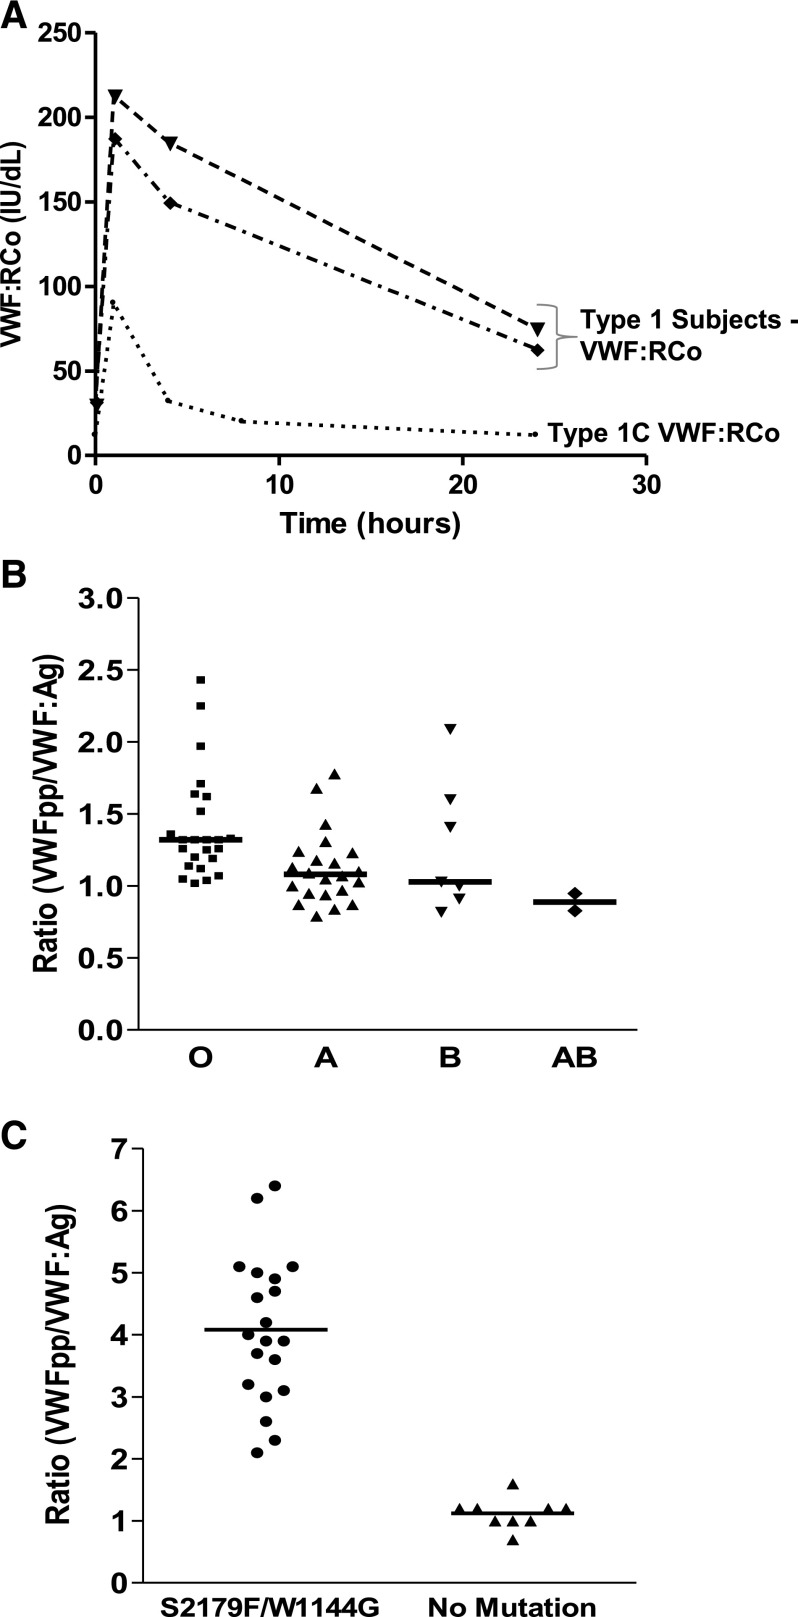
Figure 4.
Reduced VWF survival in type 1C VWD is predicted by increased baseline plasma VWFpp/VWF:Ag ratio. (A) Time course of VWF:RCo after administration of DDAVP in type 1 subjects without a reduced VWF survival phenotype (▲ and ♦), and in a patient with type 1C VWD and VWF S2179F sequence variation with reduced VWF survival (●). Although VWF is released after DDAVP administration in the type 1C VWD subject, released VWF is rapidly cleared from circulation. (B) VWFpp/VWF:Ag ratio in healthy individuals with blood groups: O (▪), A (▲), B (▾), and AB (♦). The horizontal line indicates the median VWFpp/VWF:Ag ratio. VWFpp/VWF:Ag is slightly increased in blood group O individuals. (C) Ratio of VWFpp to VWF:Ag in family members with a type 1C VWF mutation (S2179F or W1144G, circles) or without a mutation (triangles). The horizontal line represents the median value of the ratio. An elevated VWFpp/VWF:Ag ratio is identified in family members with a type 1C VWF mutation and reduced VWF survival. Adapted with permission from Haberichter et al.89

