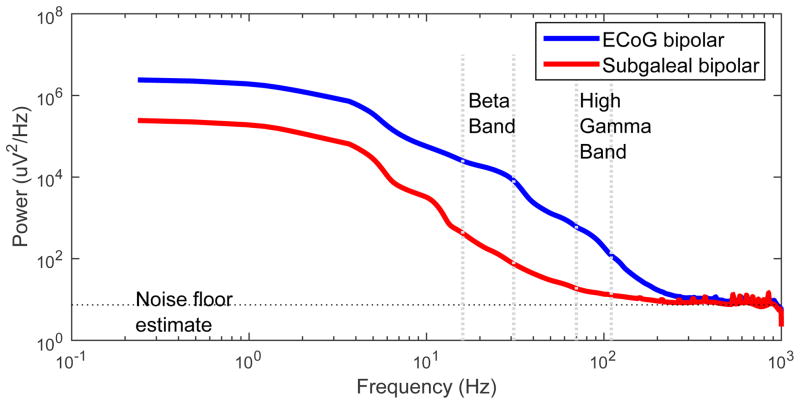
Figure 6.
Log-Log Power spectrum comparison of ECoG to SG electrodes in one example subject. Noise floor estimate is demarcated with the horizontal line. Beta (16–31 Hz) and HG (70–110 Hz) frequency bands are labeled with the vertical lines. The area under the curve but above the noise floor represents the power of neural signals in each band. Note that the ECoG and SG signals have essentially the same noise floor, and HG signal is present above the noise floor in the SG electrode.

