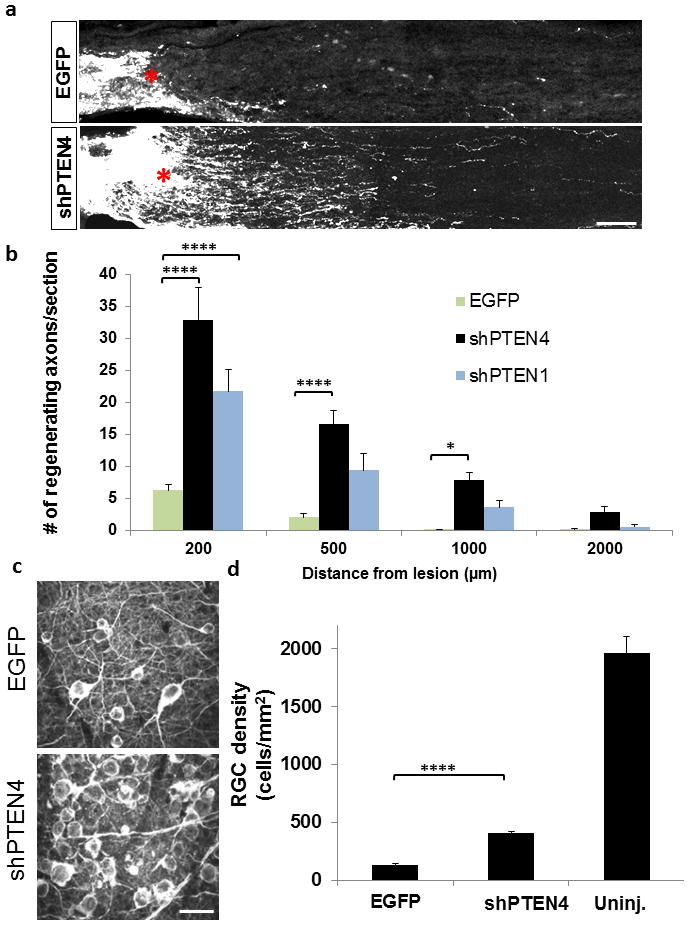
Figure 2. Assessment of RGC axon regeneration following AAV-shRNA mediated knockdown of PTEN.

(a) Representative optic nerve sections of mice receiving AAV2-shPTEN4 or control AAV2–EGFP injection. Red asterisk, lesion site. (b) Quantification of regenerating axons in control and shPTEN treated animals (n=5/group) at different distances from the lesion site. The data are represented as mean number of axons per section. (c) Representative images of TUJ1 stained wholemount retinae for both groups. (d) Quantification of RGC density (n=5/group). Error bars, SEM; ****: p<0.0001; ***: p<0.001, *p<0.05 ANOVA with Bonferroni correction (b) and student’s unpaired t-test (d). Scale bars, 100 μm (a); 20 μm (b).
