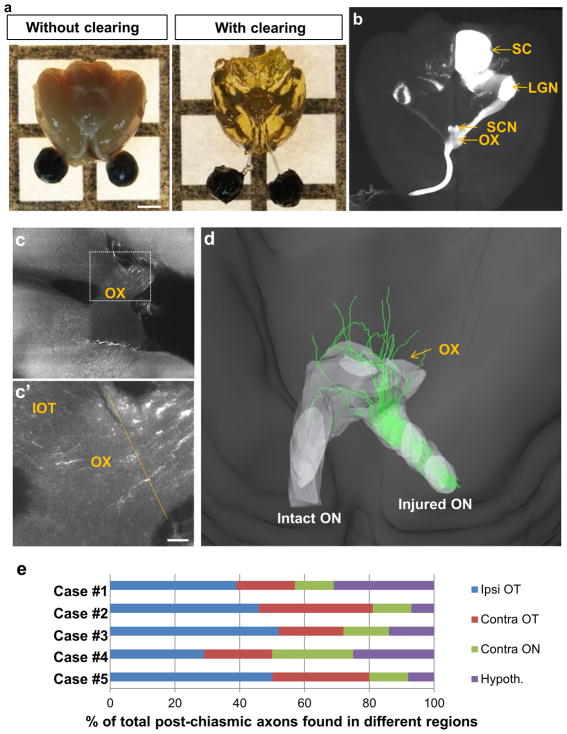
Figure 4. Tissue clearing and ultramicroscopic assessment of axonal trajectories in the optic chiasm of PCC animals.
(a) Adult mouse brains with and without tissue clearing. The eyes and optic nerves are attached to the brain. (b) Top view of an intact mouse brain. Brain from an uninjured mouse shows the entire trajectory of CTB-labeled RGC axons: all visual targets are visible, including the suprachiasmatic nucleus, lateral geniculate nucleus, and superior colliculus, ipsi- and contralaterally to the injected eye. (c) A horizontal optical slice from an unsectioned brain of a PCC-treated animal shows CTB-labeled axons in the optic chiasm. (c′) Higher-magnification of the boxed area in c. (d) Reconstruction of traced axons through the chiasm. (e) Quantification of axonal trajectories into different regions in 5 different cases (i.e. ipsi- and contralateral optic tracts, contralateral optic nerve, and hypothalamic regions). Contra, contralateral; Hypothal. Hypothalamic region; Ipsi, ipsilateral; IOT, ipsilateral optic tract; LGN, lateral geniculate nucleus; ON, optic nerve; OT, optic tract; OX, optic chiasm; 3rd V, 3rd ventricle; SC, superior coliculus; SCN, suprachiasmatic nucleus. Scale bars, 100 μm.

