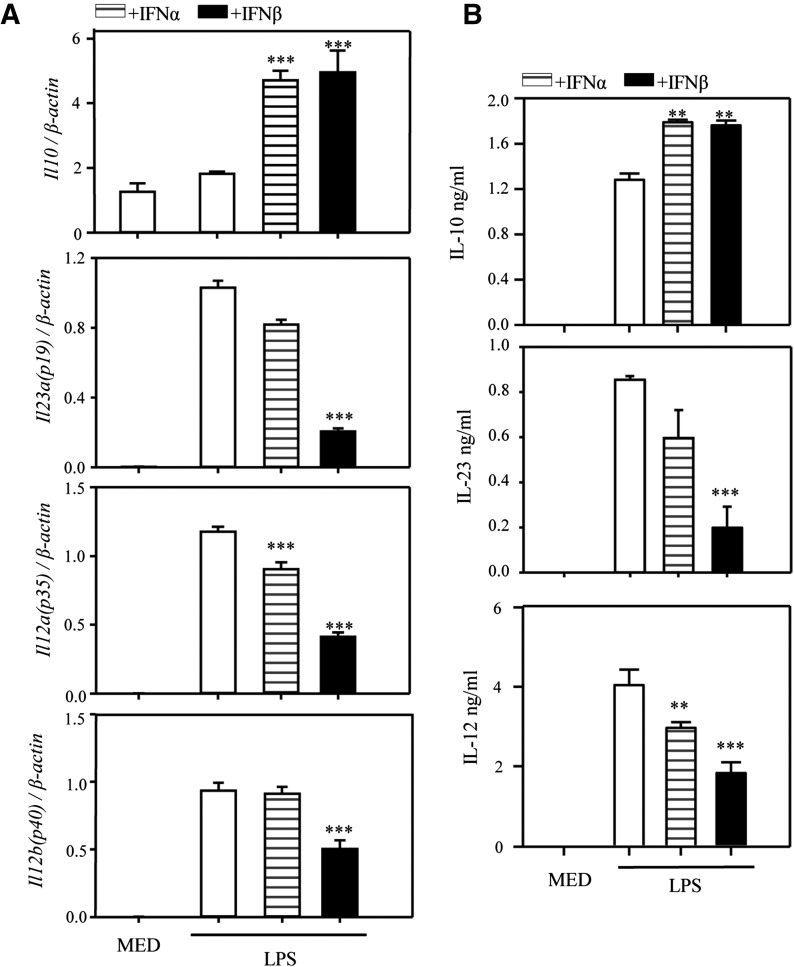
Figure 3. Effects of IFN-α and IFN-β on IL-12, IL-23, and IL-10 expression and production in LPS-stimulated DCs.
DCs were pretreated with IFN-α (1000 U/ml) or IFN-β (1000 U/ml) for 1 h, followed by LPS stimulation. (A) After 3 h [Il23a (p19)] or 6 h [Il10, Il12a (p35), Il12b (p40)], RNA was extracted, and the expression of Il10, Il23a, Il12a, and Il12b was measured by qRT-PCR. (B) After 12 h (IL-23) or 24 h (other cytokines), supernatants were collected and analyzed by ELISA for IL-10, IL-23, and IL-12 secretion. One of 3 independent experiments is shown. Results represent the means ± sd. **P < 0.01 and ***P < 0.001, compared with LPS alone.

