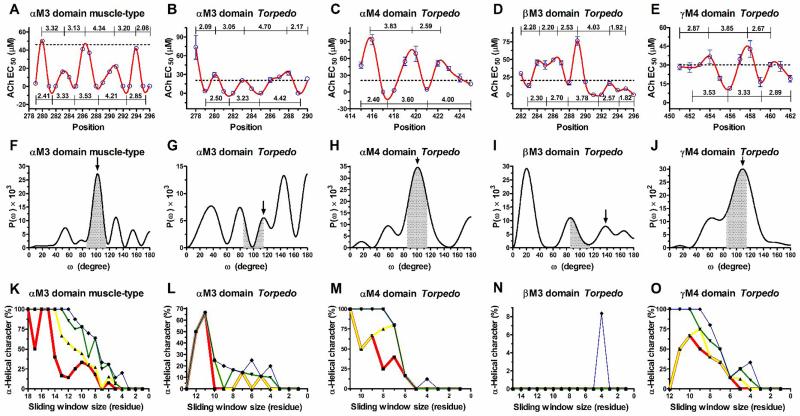
Figure 1. Tryptophan-periodicity profiles, Fourier transform power spectra, and α-helical character curves generated from tryptophan-scanning mutagenesis data of the AChR lipid-exposed transmembrane domains.
(A-E) are TrpPPs. Values along the lines indicate the number of residues per helical turn between adjacent maximums and minimums peaks. The black dashed line indicates the ACh EC50 value of the wild-type AChR. (F-J) are FT power spectra from entire sequences of the ACh EC50 values shown in the TrpPPs (A-E). The black headed arrows indicate the peaks that correspond to mean periodicities of the TrpPPs (A-E). Grey shadings demarcate the region 85° ≤ ω ≤ 115° that is used to calculate peak ratio values. (K-O) are α-helical character curves of different periodicity intervals as a function of the number of residues in the sliding window; red line (3.5 – 3.7) residues/turn; yellow line (3.4 – 3.8) residues/turn; green line (3.3 – 3.9) residues/turn; or blue line (3.2 – 4.0) residues/turn.

