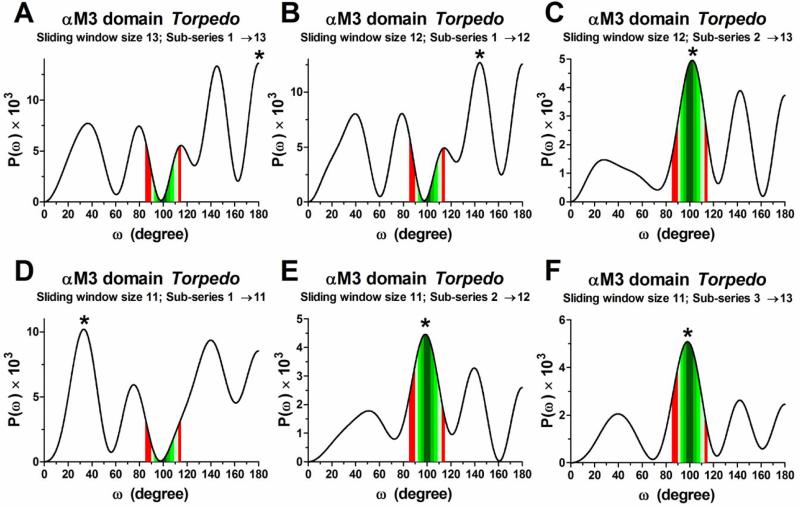
Figure 1A. Extract of the Fourier transform power spectra data from αM3 Torpedo AChR.
(A-F) are FT power spectra generated from sub-series 1→13, 1→12, 2→13, 1→11, 2→12, and 3→13 of the αM3 Torpedo data. Asterisks indicate the localization of the prominent peaks. Different intensities of green shadings demarcate the different frequency intervals; dark green (97.3°-102.9°); green; (94.7°-105.9°); bright green (92.3°-109.1°); light green (90.0°-112.5°). Red shadings demarcate the region 85° ≤ ω ≤ 115° that is used to calculate peak ratio values.

