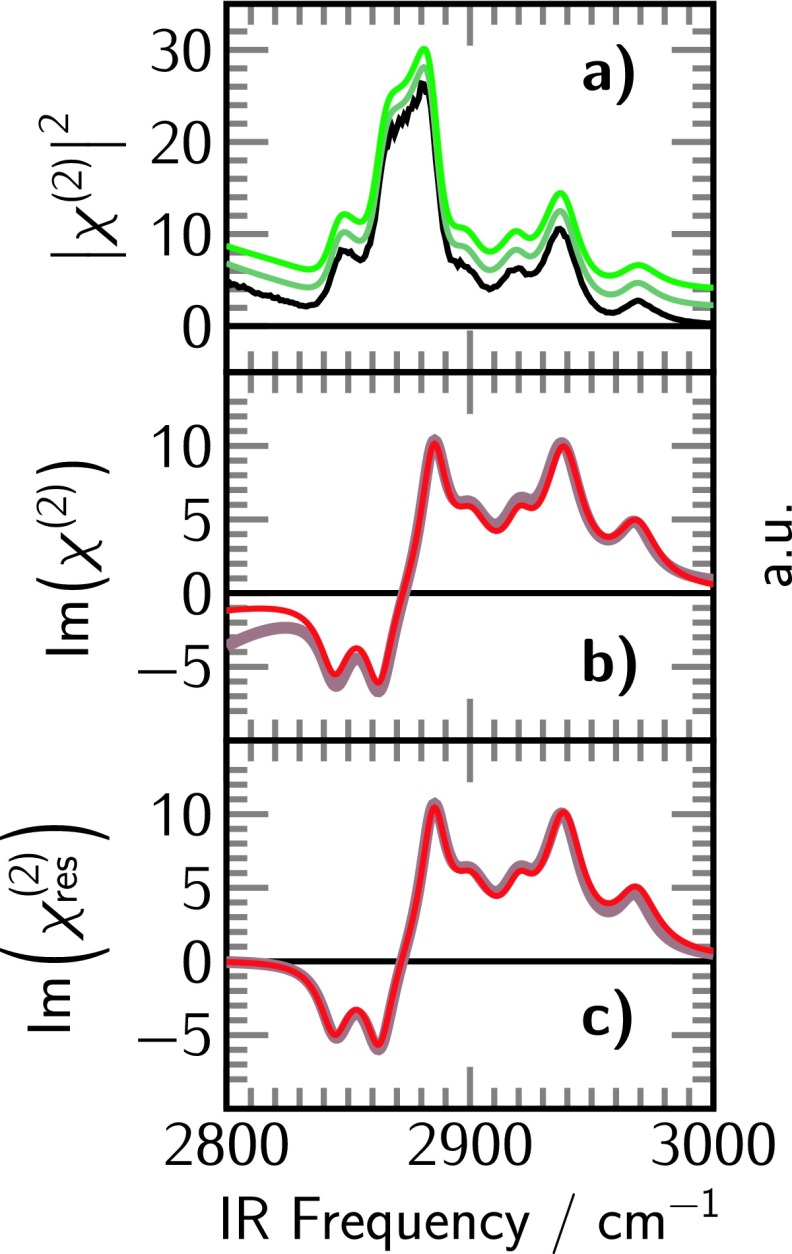
FIG. 4.
(a) Simulated intensity spectrum (black) and iMEMfit results obtained by fixing the non-resonant background peaks to the edges of the spectrum (dark green) and allowing the background peaks to vary (light green). The spectra are offset for clarity. (b) Imaginary part of the fit with fixed background positions (red-gray) and the background peaks allowed to vary (red). (c) Resonant contribution to the imaginary part of the fit with fixed background positions (red-gray) and the background peaks allowed to vary (red).

