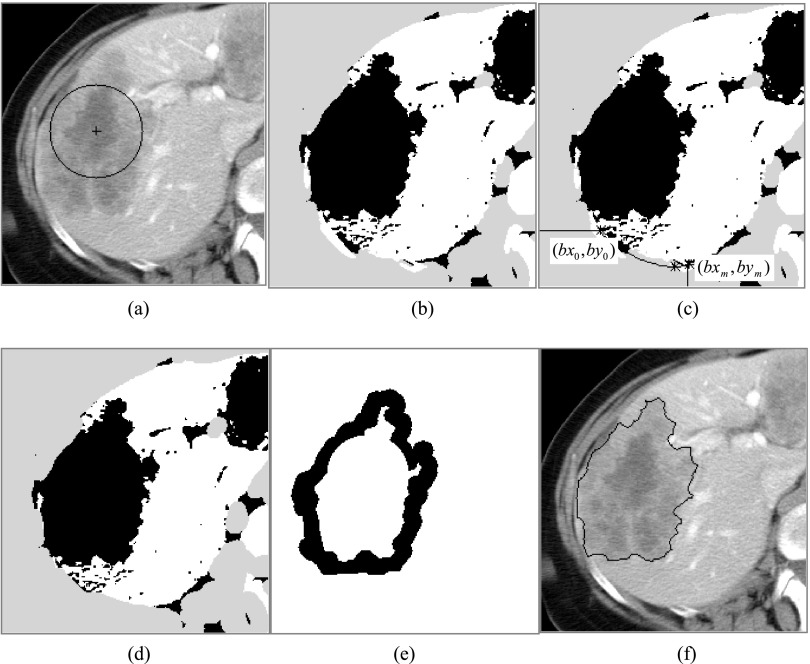
FIG. 2.
Rough segmentation of the target liver metastasis on the selected 2D reference slice. (a) The given circle; (b) the threshold result, in which the white, gray, and black represent the high-intensity, low-intensity, and middle-intensity regions, respectively; (c) illustration of deleting the rib bones; (d) the threshold result of deleting the rib bones; (e) the internal and the external markers; (f) the marker-controlled watershed segmentation results.

