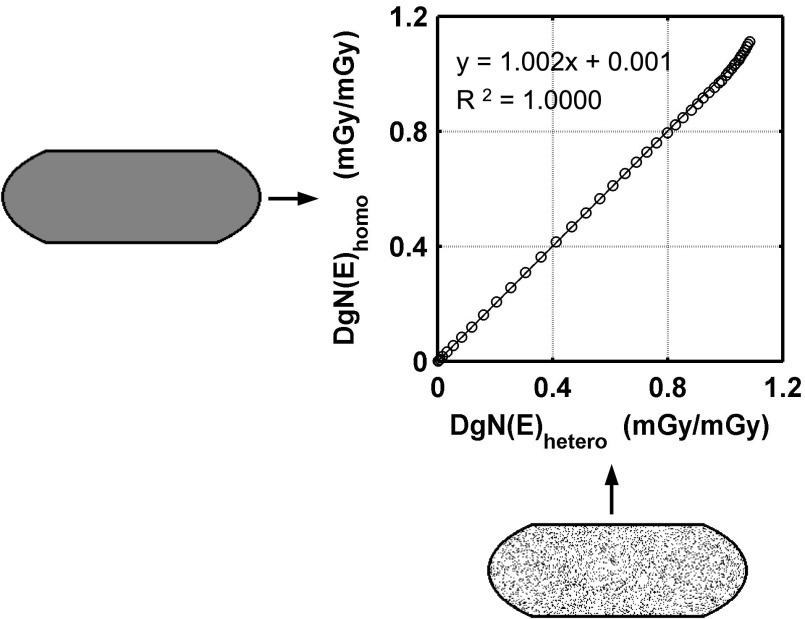
FIG. 7.
Graph showing comparison of DgN(E) results within the small phantom (V GF = 17.0%) for a homogeneous tissue composition using the homogeneous voxels (y-axis) and heterogeneous voxels (x-axis). Individual data points represent DgN(E) values for photon energies from 5 to 50 keV. No statistically significant difference was seen in the data (p = 0.117, using paired t-test).

