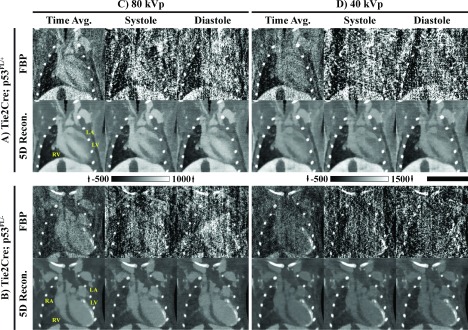
FIG. 7.

In vivo 5D reconstruction results. Rows: Reconstruction results for the (A) Tie2Cre; p53FL/+ mouse and for the (B) Tie2Cre; p53FL/− mouse. Results consist of matching weighted FBP reconstructions and 5D reconstructions using the proposed algorithm (Fig. 2). Columns: Reconstructions at (C) 80 kVp and (D) 40 kVp. Time-averaged reconstructions as well as reconstructions at end systole and end diastole are shown for matching 2D slices. Yellow, anatomic labels: RA, right atrium; LA, left atrium; RV, right ventricle; LV, left ventricle. CT data are scaled in Hounsfield units with a different scaling for (A) and (B) as shown. Scale bar: 1 cm.
