FIG 3 .
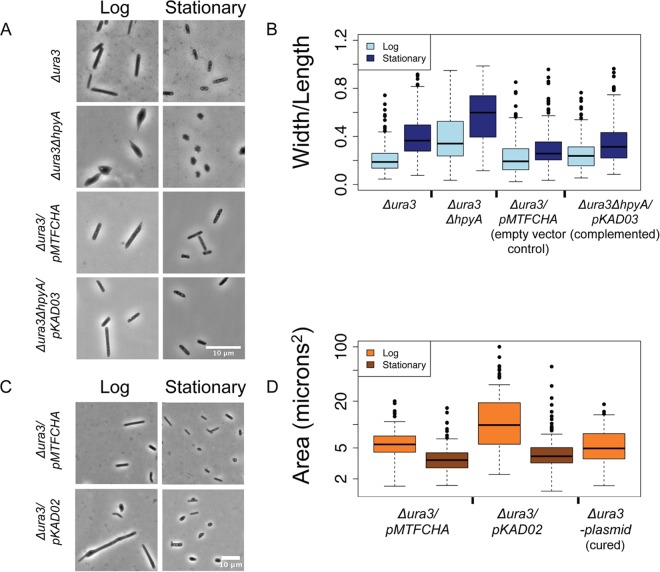
Histone dosage regulates cell shape and size. (A) Δura3 ΔhpyA cells are pleomorphic. Phase-contrast light microscopy images are shown for the Δura3 parent strain versus the Δura3 ΔhpyA histone deletion mutant and the Δura3/pMTFCHA control strain versus the Δura3 ΔhpyA/pKAD03 complemented strain in log or stationary phase of growth. (B) Individual cells were fitted as ellipses, and the width/length ratio was calculated. Error bars represent the first and fourth quartiles. For quantitation of log-phase cultures, n was ≥113 cells for each biological replicate sample. For stationary-phase cultures, n was ≥227 cells. Bar, 10 µm. (C) hpyA overexpression cells are larger than isogenic parent cells during logarithmic growth. Phase-contrast light microscopy images of the Δura3/pMTFCHA strain versus the Δura3/pKAD02 strain (histone overexpression) at mid-log or stationary phase of growth are shown. (D) Individual cells were fitted as ellipses, and area (length × width) was calculated. Error bars are as described for panel B. For quantitation of log-phase cultures, n was ≥76 cells. For stationary-phase cultures, n was ≥272 cells.

