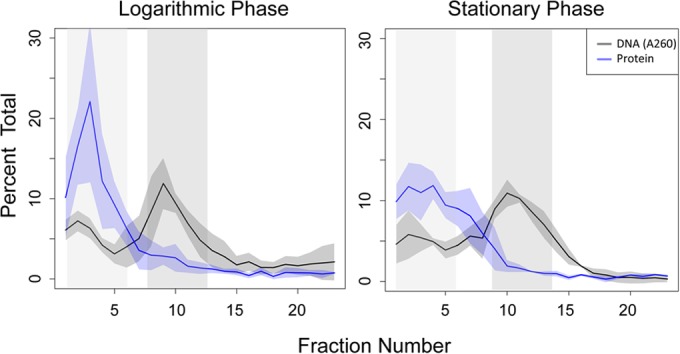
FIG 5 .

Sucrose gradient profiles of DNA and protein from each phase of growth. Proteins present in low-density fractions containing RNA (light-gray-shaded region) and higher-density fractions containing DNA (dark-gray-shaded region) were identified by tandem mass spectrometry. Nucleic acid profiles (black line; A260) and protein profiles (blue line; Bradford assay) represent the means from 3 to 4 biological replicate samples; the shaded area around each line indicates the standard deviation from the mean. Fraction 25, corresponding to unsheared lysate (26), is not shown for clarity.
