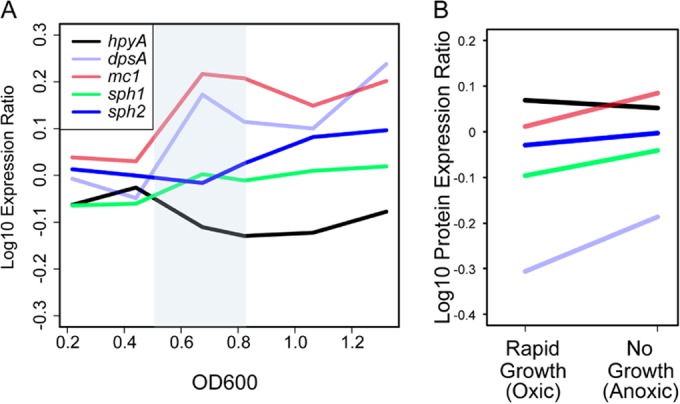
FIG 6 .

Gene and protein expression of putative NAPs as a function of growth. (A) Gene expression profiles as a function of growth phase. Normalized expression ratios for hpyA (VNG0134G), dpsA (VNG2443G), mc1 (VNG2508C), sph1 (VNG6320C), and sph2 (VNG6173C) from wild-type NRC-1 and Δura3 strain growth data from reference 36 were binned according to optical density, and average values within each bin for each gene (Materials and Methods) were plotted. The blue-shaded region highlights the period of transition from log to stationary phase. Line colors for each gene are explained in the legend. (B) Protein expression ratios of NAPs during rapid growth (oxic conditions) versus slow or no growth (anoxic conditions). Each protein profile corresponds to the mean expression under each condition. Line colors are as in panel A. Original data were obtained from reference 37.
