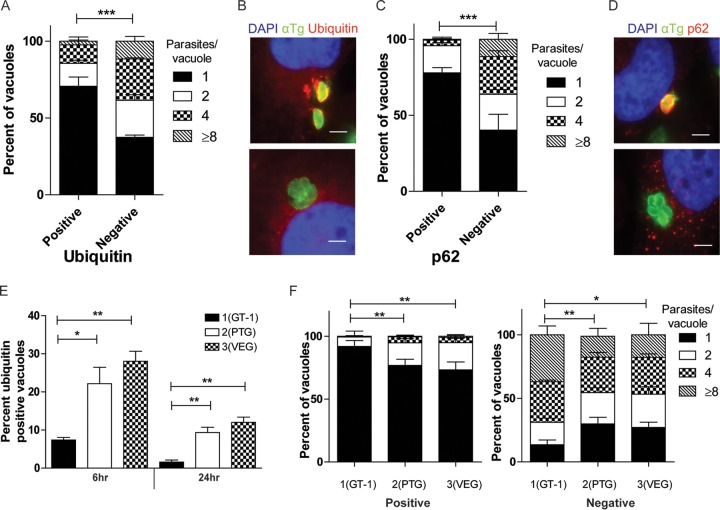
FIG 5 .
Impaired replication of T. gondii in vacuoles targeted by autophagy adaptors. Quantification of parasite replication in vacuoles positive for ubiquitin (A) or p62 (C). The number of parasites per vacuole was assessed by immunostaining for parasite surface or host cell markers, followed by epifluorescence microscopy for type 3 (VEG) parasites in IFN-γ-activated HeLa cells at 24 h postinfection. Each value is the mean ± SEM of three experiments (***, P < 0.001; two-way ANOVA). (B, D) Representative immunofluorescence images of vacuoles positive or negative for ubiquitin or p62. (B) Ubiquitin was localized with mouse MAb FK2, followed by goat-anti mouse IgG conjugated to Alexa Fluor 594 (red). Parasites were localized with a rabbit polyclonal antibody to tachyzoites, followed by goat anti-rabbit IgG conjugated to Alexa Fluor 488 (green). (D) p62 was localized with a guinea pig polyclonal antibody, followed by anti-guinea pig IgG conjugated to Alexa Fluor 594 (red). T. gondii (αTg) was localized with MAb DG52 to SAG1, followed by goat anti-mouse IgG conjugated to Alexa Fluor 488 (green). Nuclei were stained with DAPI. Scale bars, 5 µm. (E) Quantification of recruitment of ubiquitin to type 1 (GT-1), 2 (PTG), and 3 (VEG) parasites at 6 or 24 h postinfection in IFN-γ-activated HeLa cells. Each value is the mean ± SEM of three experiments (**, P < 0.01; *, P < 0.05; one-way ANOVA). Strains were compared to each other at the same time point. (F) Quantification of parasite replication of type 1 (GT-1), 2 (PTG), and 3 (VEG) parasites in vacuoles positive or negative for ubiquitin at 24 h postinfection in IFN-γ-activated HeLa cells. Replication was quantified as described above. The total numbers of positive vacuoles counted for replication were as follows: type 1, 90; type 2, 450; type 3, 450 (**, P < 0.01; *, P < 0.05; two-way ANOVA). See also Fig. S5 in the supplemental material.

