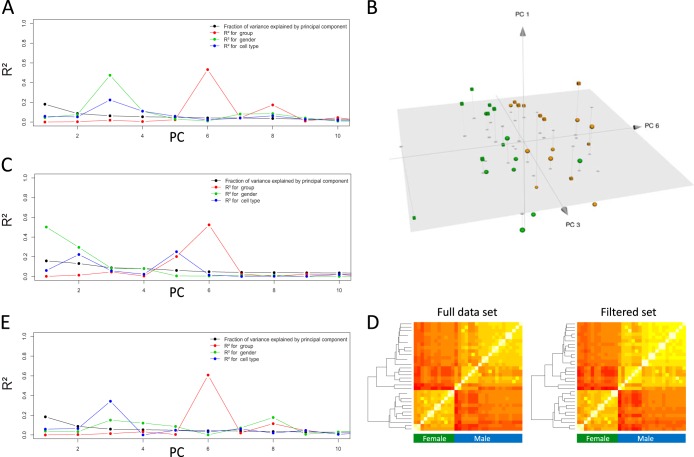
FIG 1 .
Methylation in professional phagocytes in latent Mycobacterium tuberculosis infection (LTBI) and tuberculosis (TB) illustrating sources of variance in the methylation data following principal component analysis (PCA). (A) Variance in the full data set (black line) is broken down into known sources of variance within each component of PCA, illustrating the majority of variance being explained. (B) Mainly along the axis of principal component 6 (PC6), a distinction can be made between LTBI (green) and TB (yellow): spheres, monocytes; cubes, granulocytes. (C) Variance and sources thereof following PCA analysis of the filtered set. (D) Heat maps showing correlation coefficients between the samples, from low (red) to high (yellow). Samples clustered by hierarchical clustering indicate a primary distinction between genders. (E) Variance explained in the filtered set from which all X- or Y-chromosome-associated loci were removed.

