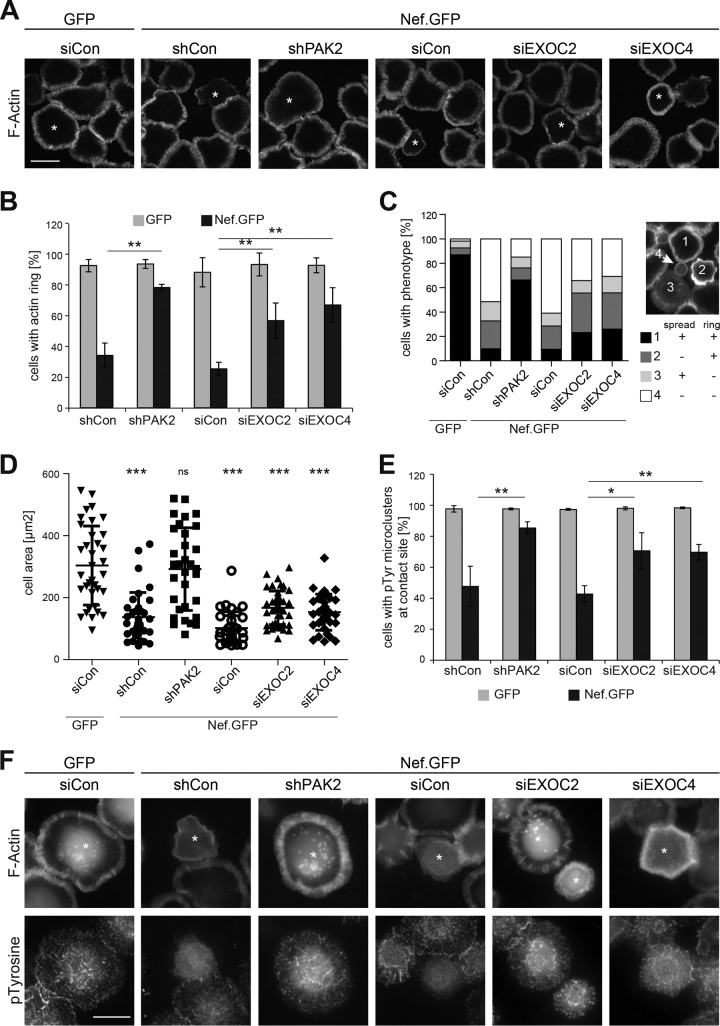
FIG 5 .
EXOC facilitates inhibition of T cell receptor-induced actin rearrangements by Nef. (A) Representative confocal micrographs of Jurkat T lymphocytes (Jurkat TAg) plated onto stimulatory coverslips for the induction of F-actin rings. Cells were treated with shRNA or siRNA, as indicated, prior to transfection with GFP or SF2 Nef.GFP expression plasmids. Four minutes after being plated onto anti-CD3ε-coated coverslips, cells were fixed and permeabilized and F-actin was stained with phalloidin-TRITC. Asterisks indicate GFP-positive cells. Scale bar, 10 µm. Further examples and dual-color images are provided in Fig. S5. (B) Frequency of cells with circumferential F-actin rings shown in panel A. Displayed are mean values ± standard deviations of three independent experiments with at least 100 cells counted per condition. (C) Stratification of cells shown in panel A into four different morphotypes based on F-actin ring formation and cell spreading. The different morphotypes are depicted in the inset as follows: 1, fully spread cells with a circumferential F-actin ring (black bars); 2, incompletely spread cells with a circumferential F-actin ring (dark gray bars); 3, fully spread cells lacking circumferential F-actin polymerization (light gray bars); 4, cells that failed to spread and lacked a circumferential F-actin ring (white bars). The graph is representative of three independent experiments with at least 100 cells counted per condition. (D) Single-cell analysis of the cell areas of the cells shown in panel A. Single-cell areas were manually determined from micrographs by ImageJ. Thirty to 40 cells with high GFP expression were randomly chosen and analyzed. Data points represent single-cell areas. Mean values ± standard deviations are indicated, and the Mann-Whitney U test was used to determine significant differences from siCon GFP. (E and F) EXOC facilitates inhibition of proximal TCR signaling by Nef. (E) Frequency of cells with pTyr microclusters shown in panel F. Displayed are mean values ± standard deviations of three independent experiments with at least 100 cells counted per condition. (F) Representative wide-field micrographs of Jurkat T (TAg) lymphocytes plated onto stimulatory coverslips for the induction of F-actin rings and p-tyrosine microclusters. Cells were treated as described for panel A. Cells were stained with phalloidin-Alexa Fluor 350 and rabbit anti-p-tyrosine antibodies and detected with Alexa Fluor 568-conjugated anti-rabbit antibody. Asterisks indicate GFP-positive cells. Scale bar, 10 µm. ns, not significant; *, P < 0.05; **, P < 0.01; ***, P < 0.001.

