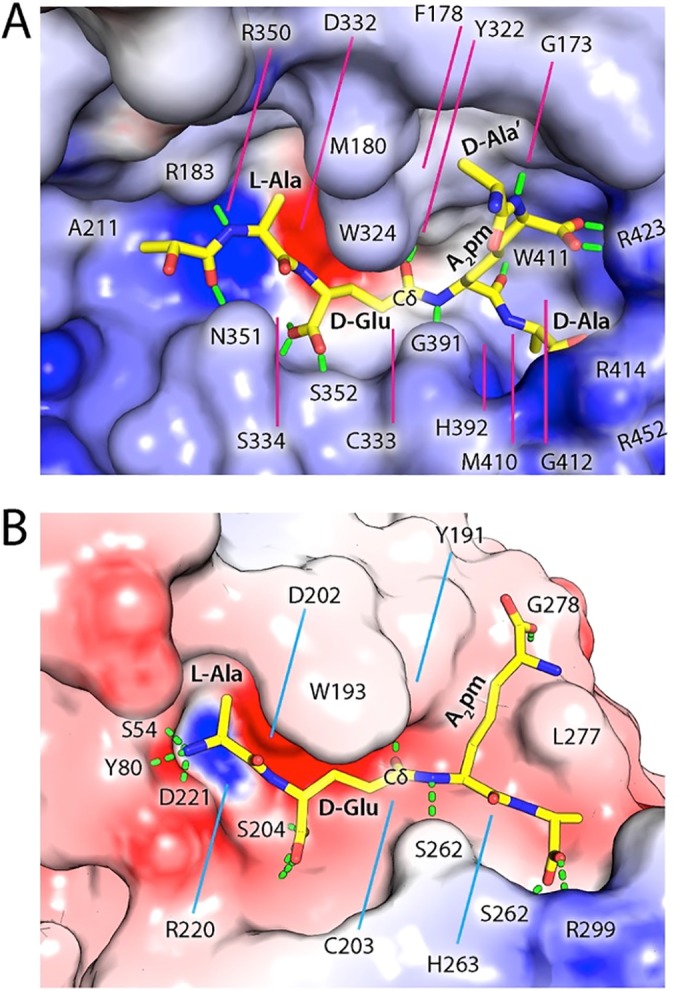
FIG 2 .

Models of substrate recognition by DvLysin and BoYkfC. (A) Interactions between the modeled substrate (shown as sticks) and the active site cavity of DvLysin. The molecular surface is colored by electrostatic potential, scaled from to −15 (red; negative) to 15 kT/e (blue; positive). Predicted hydrogen bonds between protein and substrate are shown as green dashes. Residues involved in binding the substrate are labeled. (B) A modeled tetrapeptide (sticks) in the active site of BoYkfC (colored by electrostatic potential using the same coloring scale described for panel A).
