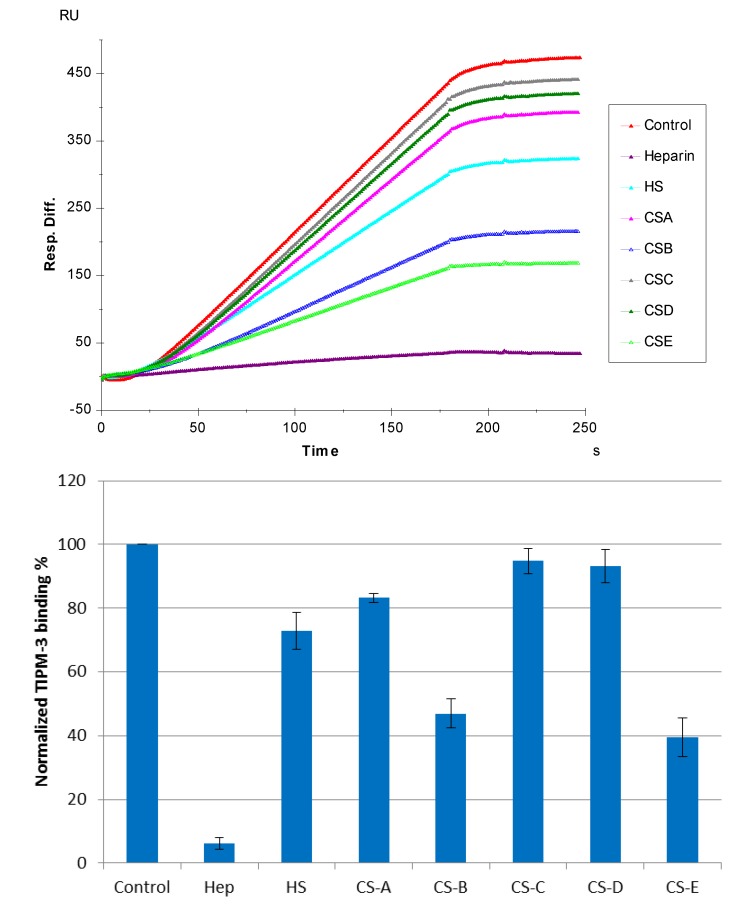
Figure 5.
(Top): Sensorgrams of solution GAGs/surface heparin competition. TIMP-3 concentration was 10 nM, and concentrations of GAGs in solution were 100 nM. (Bottom): Bar graphs (based on triplicate experiments with standard deviation) of normalized TIMP-3 binding preferences to surface heparin by competing with different GAGs.

