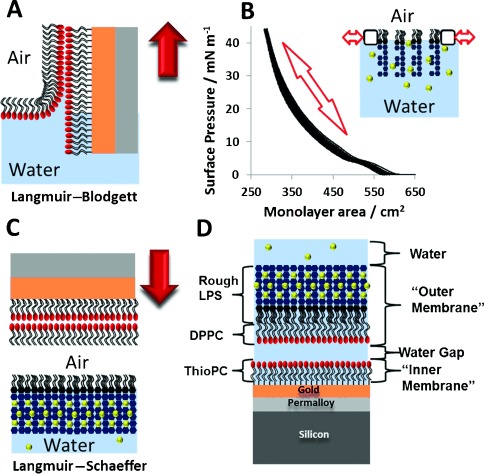
Figure 2.

Fabrication of floating asymmetric OM models. A) Langmuir–Blodgett deposition of the DPPC layer on the SAM. B) Repeated pressure–area curves of the Ra-LPS monolayer at the air–water interface to confirm stability. C) Langmuir–Schaefer deposition of the Ra-LPS layer. D) Structure of the complete OM model (inverted to enable direct comparison with Figure 1). Red arrows indicate the direction of movement of the substrate; calcium ions are shown as yellow spheres.
