
Figure 4.
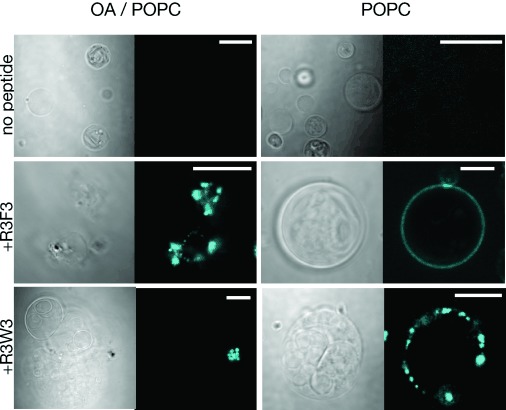
Microscopy of peptide-induced RNA–membrane association. Confocal images show RNA localization (5′-AlexaFluor647-labeled 15-mer, cyan) to the outside of oleic acid/POPC (90 %/10 %) and pure POPC membranes in the presence of R3F3 and R3W3 peptides. Control samples had no peptide added. For each image, the left panel shows the DIC image and the right panel shows AlexaFluor647 fluorescence. The scale bar is 20 μm.