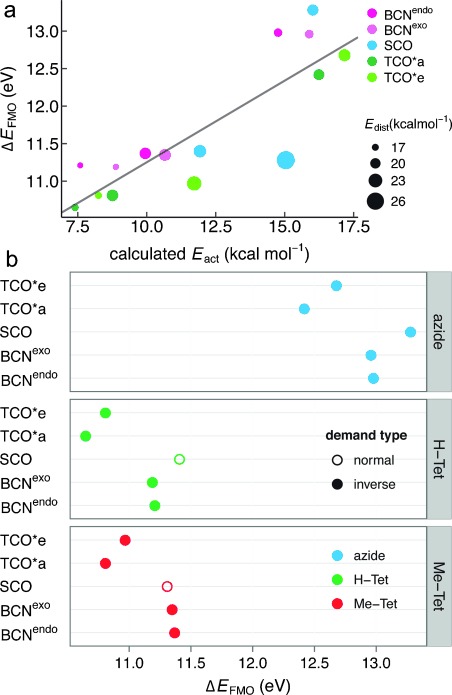
Figure 2.

Electron demand determines cycloaddition rate. a) Correlation between FMO energy differences (ΔEFMO) of the 15 distinct reactions (Eact is the barrier for the two enantiomers obtained in antiparallel tail orientation). The dot size represents the summed distortion energies of both reactants. The solid line shows the linear fit of the data. b) Electron demand of the 15 different reactant pairs according to FMO energy gaps.
