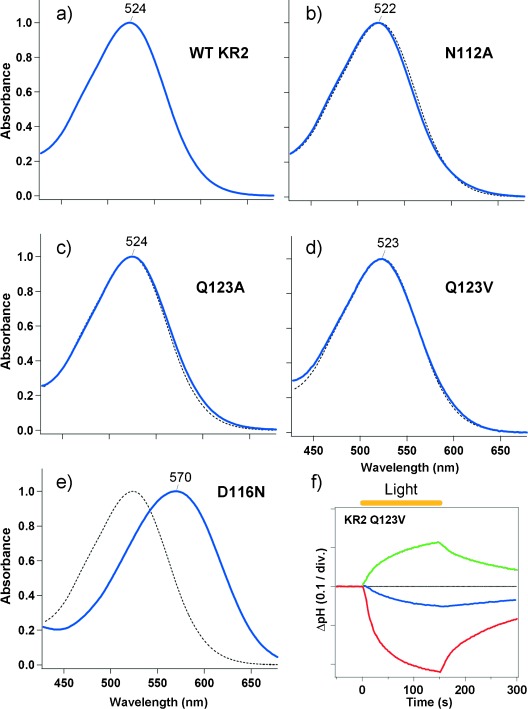
Figure 2.

UV/Vis absorption spectra of a) WT KR2, b) N112A, c) Q123A, d) Q123V, and e) D116N. The spectra of the mutants (solid blue line) are overlaid with that of the WT (dotted line). Axis labels and scales in (a–e) are the same as given in (e). f) The ion-transport activity of Q123V in E. coli cells in 100 mm NaCl (blue) or KCl (red). The green line shows the pH change in a 100 mm NaCl suspension with 10 μm CCCP. One division (div.) in the vertical axis in (f) represents 0.1 units of pH change.
