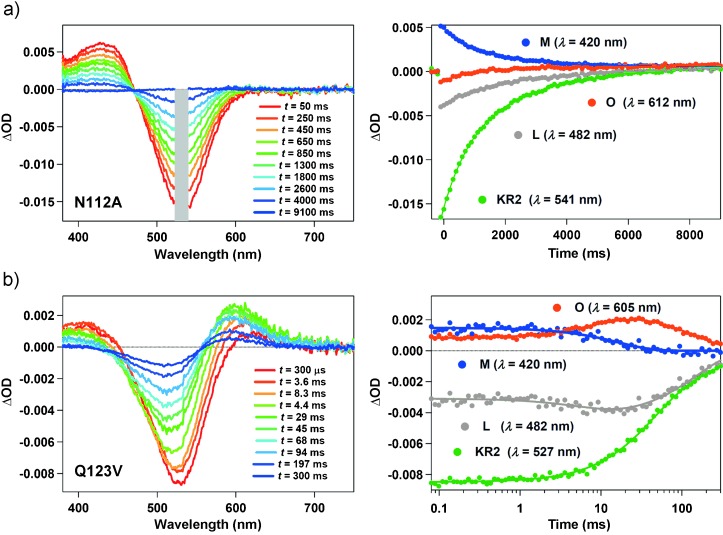
Figure 3.

Transient absorption spectra (left) and transient absorption spectral changes at specific wavelengths (right, filled circles) of a) N112A and b) Q123V. The solid lines in the right panels show the multiexponential fit to the data. OD=optical density. As a notch filter is inserted on the pathway of the probe light to remove scattered laser beam, the absorption change in the region indicated by a gray rectangle could not be detected for N112A.
