
Figure 1.
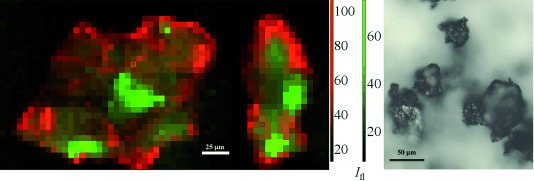
Left: Orthogonal XRF maps (at 20.3 keV) of a particle under operating conditions (ethanol, 22.3 mm nitrobenzene, and 1 bar H2) after collection of μ-XRF-CT and μ-XRD-CT sinograms. Elemental distributions throughout the carbon support are shown in red (Pt) and green (Mo). Each pixel is 5×5 μm. Red and green scale bars at the side show fluorescent signal intensity (Ifl), white scale bar (in the image)=25 µm. Right: Photo of typical catalyst particles (ex situ); scale bar=50 μm.