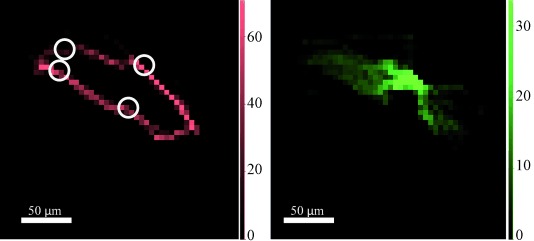
Figure 2.

Cross-sections from μ-XRF-CT at 20.3 keV showing Pt (red, left) and Mo (green, right) distributions throughout the carbon support. Each pixel is 5×5 μm. Data collected under operating conditions (ethanol, 22.3 mm nitrobenzene, and 1 bar H2). The slice corresponds to a horizontal cross-section 60 μm from the bottom of the particle (see Figure 1). The white circles correspond to the approximate locations of the Pt crystals (identified from the 111 reflection). Scale bars at the sides show fluorescent signal intensity (Ifl), white scale bars (within the images)=50 µm.
