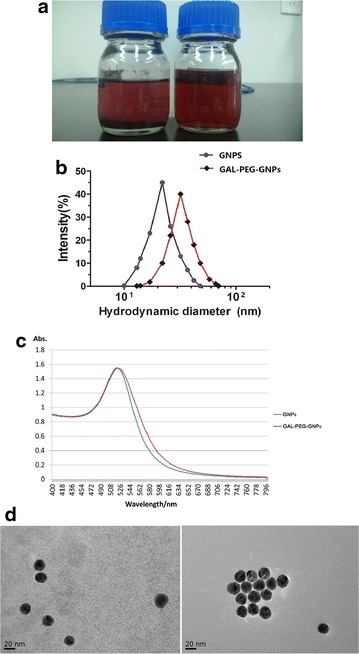
Fig. 2.

Characterization of nanoparticles. a Shows appearance of GNPs (left) and GAL-PEG-GNPs (right); b shows size distribution of GNPs (blue) and GAL-PEG-GNPs (red), respectively; c shows absorption peak of GNPs (blue) and GAL-PEG-GNPs (red), respectively; d shows the images of GNPs (left) and GAL-PEG-GNPs (right) detected by TEM
