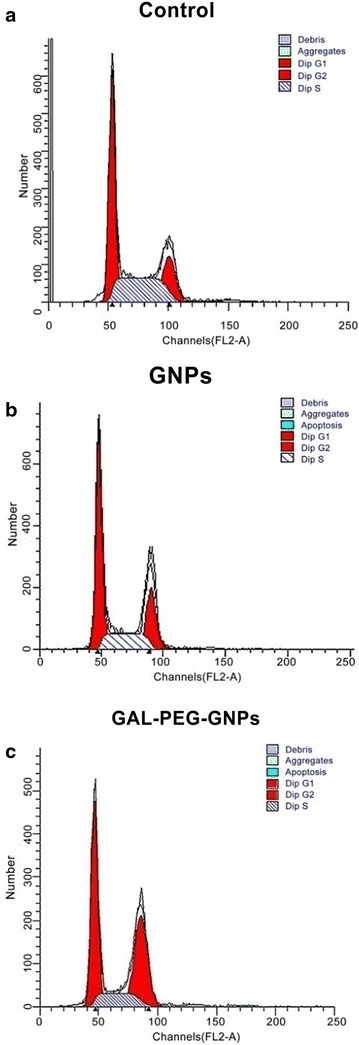
Fig. 6.

Cell cycle distribution of HepG2 was detected by flow cytometry (n = 3). a Control: G0/G1 phase (60.26 ± 2.96) %, S phase (31.65 ± 0.81) %, G2/M phase (8.09 ± 2.2) %. b GNPs: G0/G1 phase (55.89 ± 1.7) %, S phase (23.97 ± 0.54) %, G2/M phase (20.26 ± 2.09) %, c GAL-PEG-GNPs: G0/G1phase (55.39 ± 1.25) %, S phase (17.67 ± 1.01) %, G2/M phase (27.03 ± 0.7) %. (p < 0.01) compared to Control; (p < 0.01) compared to Control and GNPs group
