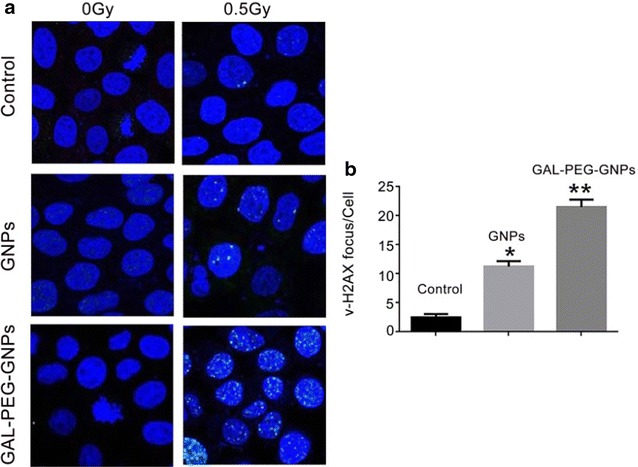
Fig. 8.

Immage of γH2AX focus in HepG2 cells. a Shows the γH2AX focus in HepG2 cells. b Sows DSB induction as determined by the γ-H2AX assay was quantified as focus integrated density per unit nucleus area using Image J software. Data represent the mean results from three independent experiments. Compared with the control group, *p < 0.001, compared with GNPs, **p < 0.001
