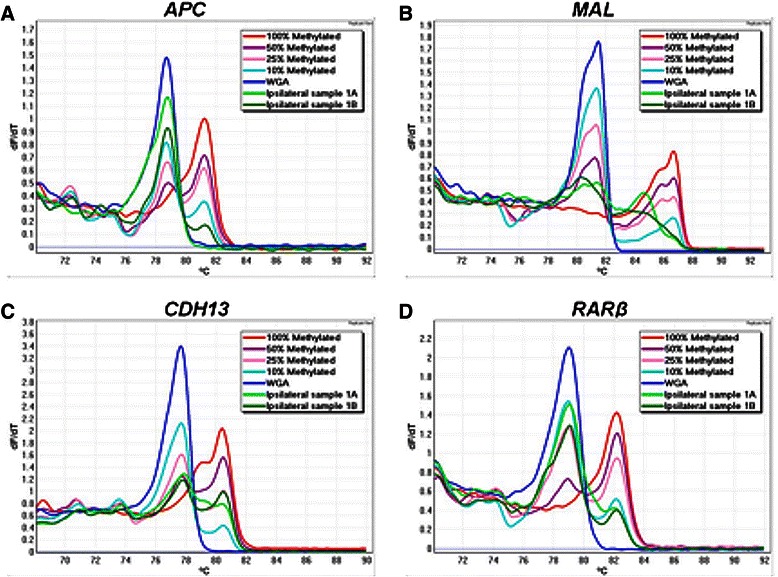
Fig. 1.

Examples of MS-HRM analysis of a APC, b MAL, c CDH13 and d RARβ genes in ipsilateral sample 1. The figure shows negative first derivative (Tm) melting curves of the MS-HRM profiles. MS-HRM differentiates the methylated DNA from the unmethylated DNA based on the sequence-dependent thermostability. Fully methylated samples melt later than the unmethylated WGA samples as there are cytosines retained in the sequence after bisulfite modification. Standards with different methylation levels (10 %, 25 % and 50 %) were prepared by mixing the fully methylated DNA with fully unmethylated DNA. Ipsilateral sample 1A represents the first tumour and 1B represents the second tumour
