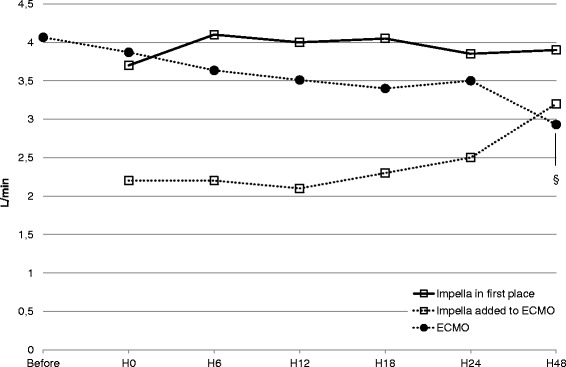
Fig. 1.

Variations of mechanical circulatory support flow (median values) before and during the first 48 h of Impella support. Impella flow is represented by empty squares and ECMO flow by full circles. § p < 0.05 for comparison with H0 flow, paired Wilcoxon test. ECMO extracorporeal membrane oxygenation
