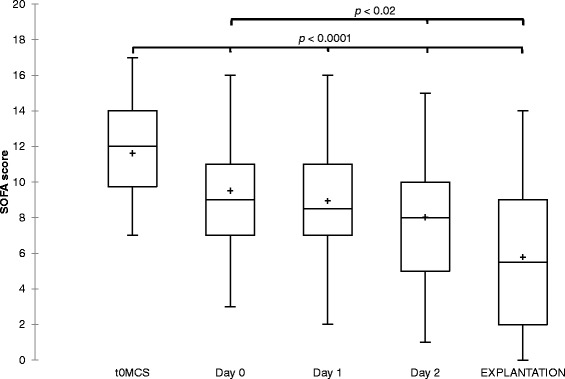
Fig. 2.

Box plots of serial monitoring of the SOFA score, before mechanical circulatory support (t0MCS), during the first 48 h of Impella support and at the day of Impella removal. The line in the box indicates the median value of the data and the cross indicates the mean value. Paired Wilcoxon test for comparison with values at t0MCS and at day 0. SOFA Sepsis-related Organ Failure Assessment
