Figure 1.
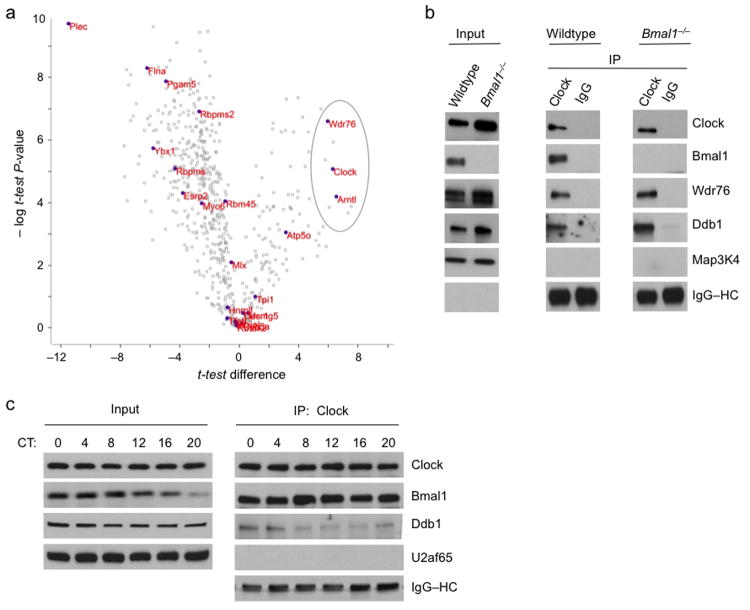
Identification of Wdr76 and Ddb1 in a Clock–Bmal1 complex. (a) Volcano plot54 showing results of a modified t-test analysis of label-free mass spectrometry data comparing E-box and control oligonucleotide affinity purification from livers of wild type and Bmal1 mice (see Supplementary Figure 1). Open gray rectangles represent proteins detected, closed purple circles with accompanying names represent proteins significantly associated with the E-box sequence (FDR < 0.05, one tailed t-test of E-box vs. mutated E-box, n = 5 biological replicates), and the gray oval encompasses the three proteins significantly dependent on both the E-box sequence and the presence of Bmal1 (FDR < 0.05, one-tailed t-test of wild type vs. Bmal1–/–, n = 5 biological replicates). (b) Immunoblots of liver nuclear extract (CT6) from wild type or Bmal1–/– mice (Input) and immunoprecipitates (IP) from the extract (antibodies at top) probed with the antibodies indicated at right. Map3K4 (mitogen-activated protein kinase kinase kinase-4) served as negative control, and IgG–heavy chain (HC) served as positive control for immunoprecipitation (see Supplementary Figure 2). (c) Immunoblots of mouse liver nuclear extracts obtained across a circadian cycle (Input) and Clock immunoprecipitates from the extracts probed with the antibodies indicated at right. U2af65 (65-kD subunit of U2 small nuclear ribonucleoprotein particle auxiliary factor), negative control; IgG–HC, positive control. Uncropped images are presented in Supplementary Data Set 1.

