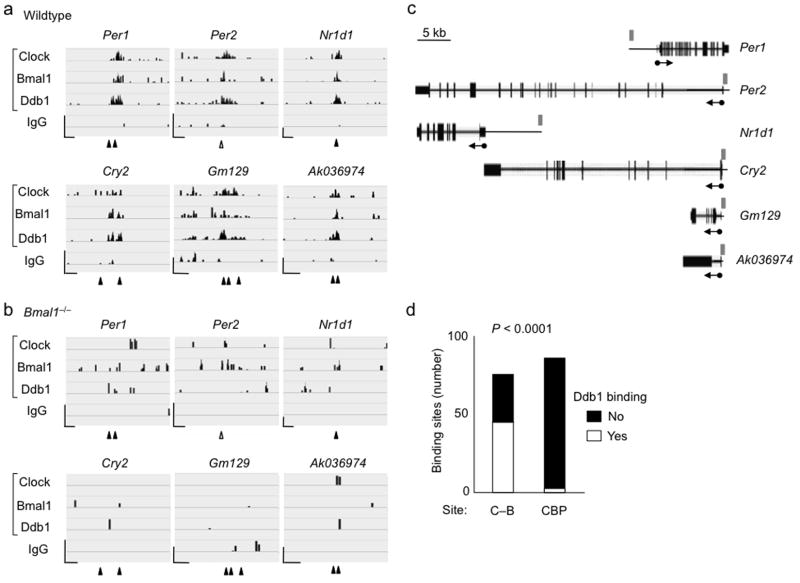
Figure 3.
Clock–Bmal1 recruits Ddb1–Cul4 to many circadian target genes. (a) Six examples of ChIP-seq data alignments (Integrative Genome Viewer55) for Clock, Bmal1, and Ddb1 occupancy (as indicated) at validated Clock–Bmal1 E-box binding sites in wild type mouse liver (CT6). ChIP-Seq for IgG served as a negative control. Tick marks correspond to sequence reads along the length of the gene. Closed arrowheads, site of canonical E-box; open arrowhead, site of non-canonical E-box. Scale bars at lower left of each panel: vertical = 25 reads; horizontal = 500 bp. (b) Corresponding examples from identical experiment performed with liver chromatin from Bmal1–/– mice, displayed as in (a). Coordinates of genomic regions displayed: Per1, chr11:68906486-68910610; Per2, chr1:93354281-93357619; Nr1d1, chr11:98642602-98646726; Cry2, chr2:92272900-92275638; Gm129, chr3:95685093-95687497; AK036974, chr5:149805686-149807984. Total reads in (a) and (b), respectively: Clock, 16,103,538 and 22,043,586; Bmal1, 26,372,784 and 21,140,374; Ddb1, 15,984,254 and 19,760,087; IgG, 13,702,153 and 21,501,883. (c) Diagram showing relationship of data displayed in panels (a) and (b) to the structures of the relevant genes. Scale bar at top left. Thin boxes, untranslated regions; thick boxes, exons. Arrows denote start site and direction of transcription. Gray rectangles indicate relative positions of view shown in (a) and (b). (d) Summary of genome-wide ChIP-seq data comparing recruitment of Ddb1 to Clock–Bmal1 binding sites (C–B) and CBP binding sites, which correspond to the sites of many transcriptional activators. P-value was determined by Fisher’s exact test from a 2 × 2 contingency table (see Online Methods).

