Figure 5.
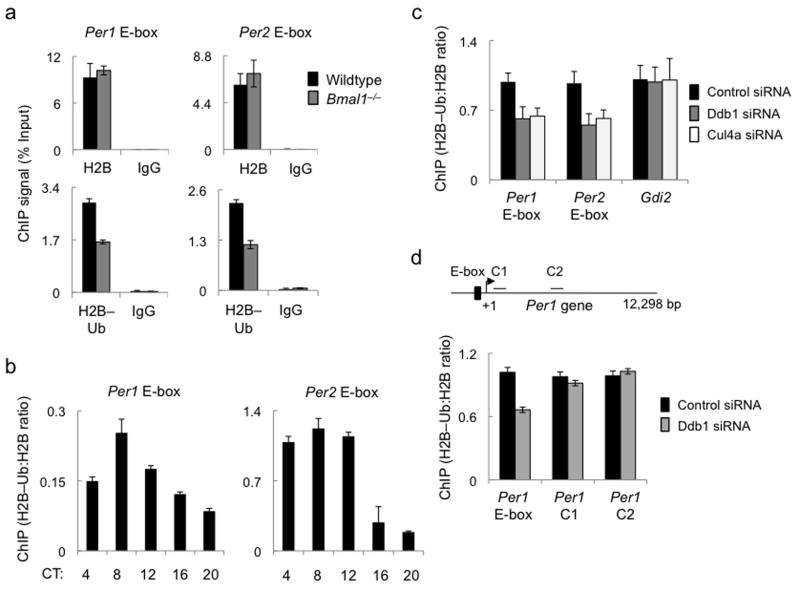
Ddb1 and Cul4a promote H2B mono-ubiquitination at circadian E-box sites. (a) Top panels: ChIP assays showing total H2B or parallel IgG control from liver nuclear extracts (CT6) of wild type (black) or Bmal1–/– mice (gray) at Per1 (left) and Per2 (right) E-box sites. Bottom panels: ChIP assays (as in top panels) showing H2B–Ub or parallel IgG control. (b) ChIP assays from mouse liver nuclear extracts showing H2B–Ub (normalized to total H2B) across the circadian cycle at the Per1 (left) and Per2 (right) E-box sites (see Supplementary Figure 4). (c) ChIP assays from mouse fibroblasts showing H2B–Ub (normalized to total H2B) at Per E-box sites or an arbitrary control gene promoter (marked at bottom) after introduction of indicated siRNAs. (d) Top: diagram of mouse Per1 gene showing positions of E-box and control sites C1 and C2 within the gene. Arrow and +1 mark transcription start site. Bottom: ChIP assays from mouse fibroblasts showing H2B–Ub (normalized to total H2B) at the indicated Per gene sites (marked at bottom) after introduction of control siRNA or Ddb1 siRNA. ChIP data are displayed as mean +/- SD of triplicate experiment; representative of 3 independent experiments.

